

Question: Consider the simple linear regression model fit to the steam plant data in Problem 2.12. Problem 2.12 The number of pounds of steam used per
Consider the simple linear regression model fit to the steam plant data in Problem 2.12.
Problem 2.12
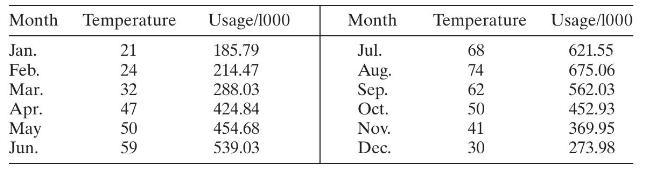
The number of pounds of steam used per month at a plant is thought to be related to the average monthly ambient temperature. The past year's usages and temperatures follow.
a. Construct a normal probability plot of the residuals. Does there seem to be any problem with the normality assumption?
b. Construct and interpret a plot of the residuals versus the predicted response.
c. Suppose that the data were collected in the order shown in the table. Plot the residuals versus time order and comment on the plot.
Month Temperature Usage/1000 Month Temperature Usage/1000 Jan. 21 185.79 Jul. 68 621.55 Feb. 24 214.47 Aug. 74 675.06 Mar. 32 288.03 Sep. 62 562.03 Apr. 47 424.84 Oct. 50 452.93 May 50 454.68 Nov. 41 369.95 Jun. 59 539.03 Dec. 30 273.98
Step by Step Solution
3.48 Rating (145 Votes )
There are 3 Steps involved in it

Get step-by-step solutions from verified subject matter experts