

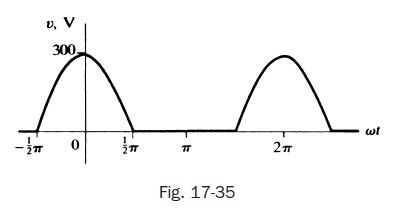
The voltage wave shown in Fig. 17-35 is applied to a series circuit with R = 2
Question:
The voltage wave shown in Fig. 17-35 is applied to a series circuit with R = 2 kΩ and L = 10 H. Use the trigonometric Fourier series to obtain the voltage across the resistor. Plot the line spectra of the applied voltage and vR to show the effect of the inductance on the harmonics. Assume ω = 377 rad/s.
Fantastic news! We've Found the answer you've been seeking!
Step by Step Answer:
The applied voltage has average value V max p as in Problem 175 The wave function ...View the full answer

Answered By
Kenneth Welch
I always have the same care and concern for my students that I have for my four children.
I have multiple tutoring methods and will continue tutoring until the student learns the lesson.
I can relate the lesson to the student's interests. For example, if he likes football, I can show the student how to apply math to football.
0 Reviews
10+ Question Solved
Related Book For 
Schaum S Outline Of Electric Circuits
ISBN: 9781260011968
7th Edition
Authors: Mahmood Nahvi, Joseph Edminister
Question Posted:
