New Semester
Started
Get
50% OFF
Study Help!
--h --m --s
Claim Now
Question Answers
Textbooks
Find textbooks, questions and answers
Oops, something went wrong!
Change your search query and then try again
S
Books
FREE
Study Help
Expert Questions
Accounting
General Management
Mathematics
Finance
Organizational Behaviour
Law
Physics
Operating System
Management Leadership
Sociology
Programming
Marketing
Database
Computer Network
Economics
Textbooks Solutions
Accounting
Managerial Accounting
Management Leadership
Cost Accounting
Statistics
Business Law
Corporate Finance
Finance
Economics
Auditing
Tutors
Online Tutors
Find a Tutor
Hire a Tutor
Become a Tutor
AI Tutor
AI Study Planner
NEW
Sell Books
Search
Search
Sign In
Register
study help
sciences
geology
Practical Seismic Data Analysis 1st Edition Hua-Wei Zhou - Solutions
Discuss the differences between a depth migration and a time migration followed by a time to depth conversion.
A well \(\log\) records a physical property at a constant depth increment of \(1 \mathrm{ft}\) \(\left(w_{j}=w\left(j^{*} \Delta z\right), \Delta z=1 \mathrm{ft}\right)\). A depth-to-time conversion of the well log gives a variable time interval due to velocity variations. How would you extract the
How can you constrain Kirchhoff migration so that it will produce a result similar to that from a NMO stacking? Discuss what is missing from NMO stacking if taking it as a seismic imaging method.
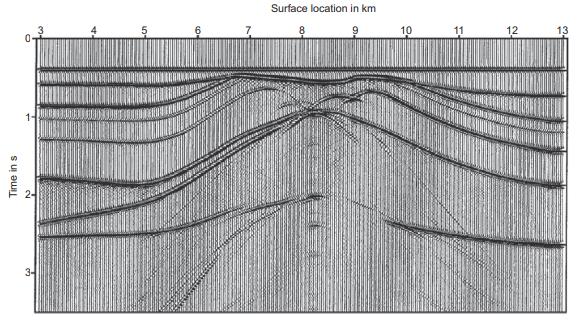
For the zero-offset section shown in Figure 7.11, apply the common-tangent method to obtain the migrated section.Figure 7.11 Time in s d 3- 6 Surface location in km 8 9 10 11 12 23 13
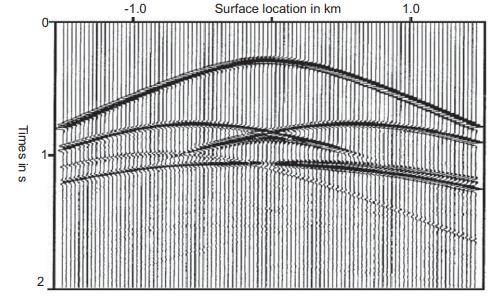
Figure 7.12 shows a common-shot gather over a five-layer model using a line of surface receivers and a single surface shot in the middle. Write a procedure to migrate these data and show your migration result.Figure 7.12 0- Times in s -1.0 Surface location in km 1.0 2
Explain the use of Fourier transform in Stolt migration. What are the benefits of using FT? What is the assumption involved in the use of FT?
Read the paper by Stoffa et al. (1990) on split-step Fourier migration, and create a summary covering the procedure, assumptions, benefits, and limitations of the method.
Compare and contrast between the PSPI and split-step \(f-k\) migration methods. How does each method treat the lateral velocity variations?
Describe the assumptions and procedure of reverse time migration.
If only first arrivals can be recognized in our data, will the RTM still be applicable? What kinds of target may be imaged by such RTM? What may be the problems?
The imaging condition for the RTM described in Section 7.4.3 involves cross-correlating the forward- and backward-propagated wavefields. Can you suggest other types of imaging condition? For the described imaging condition and for your imaging conditions, what situations may limit their
Describe the general assumptions and procedure of seismic migration. What are the specifics for Kirchhoff, Stolt, and reverse time migration methods? For seismic data in an area with nearly flat reflectors, will migration be necessary?
How would you check the quality of a seismic migration method? Make a list of tests that you would conduct in order to quantify the quality.
Someone has said that smoothing the velocity model is a practical way to improve the migration result. Discuss the possible effects of smoothing velocity model on seismic migration. What are the potential benefits and drawbacks from the smoothing?
Using a spreadsheet to compile observed \(1 \mathrm{D}\), or \(V(z)\), profiles from the literature, make a list of entries to include location, geologic setting, wave type, frequency, depth range, velocity profile, reference (authors, year, and publication), etc.
If velocity increases linearly with depth, what is the maximum depth of the raypath of a first arrival at \(10-\mathrm{km}\) offset between a source and a receiver located on the surface?
The traveltimes and raypaths of transmitted and reflected waves are dependent on velocity variation but independent of density variation. The amplitudes of transmitted and reflected waves depend on the variations of both velocity and density. Can you devise a way to extract density variation using
In semblance velocity analysis we usually stack all traces with equal weight. Should we apply variable weights as a function of offset and intersection time? Devise a way to conduct such a weighted semblance stack process.
Explain why the root-mean-square velocity is not the exact stacking velocity. Which of the two velocities is usually faster than the other and why?
Use an Excel spreadsheet to illustrate the Cheops Pyramid in imaging a point diffractor.
Some people say that a correct velocity model will result in a more focused migration image. Explain the possible reasons for this statement, and its limitations.
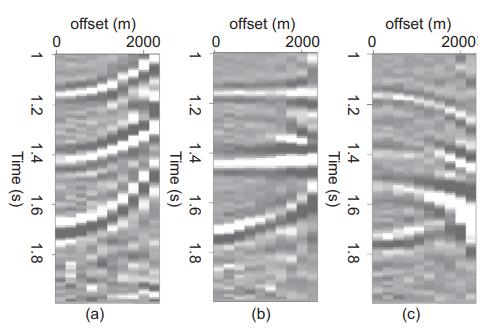
Explain why, even when using the correct velocity model, some reflection events on a CIG may not be flat (e.g. in Figure 8.21b).Figure 8.21b offset (m) 2000 1 0 offset (m) 2000 1 offset (m) 2000 0 1 1.2 1.4 1.6 1.8 Time (s) 1.2 1.4 1.6 Time (s) 1.2 1.4 1.6 Time (s) 1.8 1.8 (a) (b) (c)
Explain the notion that the NMO plot is a special case of the CIG plot. Compare and contrast the two plots. Can you construct a semblance graph for a CIG?
While traveltime tomography derives model updates by minimizing the traveltime misfit, are there other constraints and information that we can use to help the process? Make a list of such extra information and give some details on how to use each constraint.
Devise a residual velocity tomography method for common image gathers based on the Kirchhoff migration. Please provide the main formula and a list of procedures of your method.
What are the factors that we should consider in selecting the multi-scale elements in multi-scale tomography? Make a checklist for best-practice procedure in conducting multi-scale tomography.
Compile a list of the "rule of thumb" ways to \(\mathrm{QC}\) at least five types of common tomographic artifacts. Specify the tests that can be conducted to verify the artifact and quantify its extent.
Make a computer algorithm to illustrate the de-mean artifact in traveltime tomography.
How should we deal with localized velocity anomalies, such as a small salt body, in deformable-layer tomography? Make a 2D computer algorithm to illustrate your idea.
Under what conditions may data fitting be superior to model inversion? What are the conditions for the reverse case?
How common is it in the Earth that the density is much more slowly varying than the velocity, like that shown in the first two logs in Box 9.1 Figure 1 ? Given a slowly varying function and a rapidly varying function, which one is easier to invert for and why?
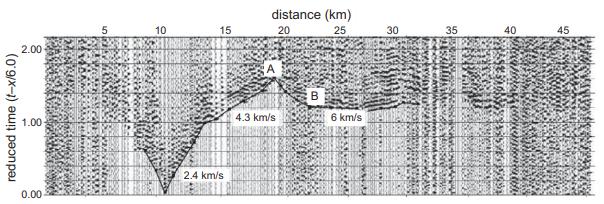
In Figure 9.8 , if the velocity follows a layer-cake model, what is the value of the velocity corresponding to the \(\mathrm{AB}\) segment of the first arrivals?Figure 9.8 reduced time (t-x/6.0) distance (km) 10 15 20 2.00 1.00 0.00 2.4 km/s 4.3 km/s 25 30 35 40 40 B 6 km/s 45
Why is the definition of length measure or norm an important issue for inverse theory? How does the issue connect with real signal and noise properties?
Discuss the benefits of expressing a function as the combination of basis functions like that shown in (9-16). What are the preferred properties of the basis functions?
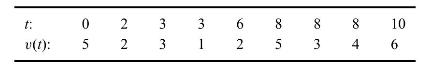
An experiment yielded the following measures of a function \(v(t)\) :(a) Graph the data;(b) Write the forward system of a linear fit, and its \(\mathrm{L}_{2}\) inverse system;(c) If we want to force the linear trend to go through a point \(\left(t_{0}, v_{0}\right)\), what would be the forward
If you have a least squares algorithm already, how will you use this algorithm to solve for the \(\mathrm{L}_{1}\) solution? In other words, how will you minimize the \(\mathrm{L}_{1}\) error using this least squares algorithm?
When Sir Harold Jeffreys analyzed seismic traveltime residuals, he noticed that the distribution of the residuals was not quite Gaussian. He expressed it as\[ f(t)=\frac{1-\varepsilon}{\sqrt{2 \pi \sigma}} \exp \left[-\frac{(t-\bar{t})^{2}}{2 \sigma^{2}}\right]+\varepsilon g(t) \]where \(g(t)\)
Why it is difficult to derive the focal depth of earthquakes? Can we use first arrivals at three stations to determine four focal parameters \(\left(x, y, z, T_{0}\right)\) ?
Show that if \(\lambda\) is an eigenvalue of the problem \(\mathbf{A x}=\lambda \mathbf{x}\), it is also an eigenvalue of the "adjoint" problem \(\mathbf{A}^{\mathrm{T}} \mathbf{y}=\lambda \mathbf{y}\).
For a \(2 \times 2\) matrix \(\mathbf{A}=\left(\begin{array}{cc}10 & 2 \\ -10 & 2\end{array}\right)\)(a) Take an eigenvalue-eigenvector decomposition, i.e., find \(\mathbf{X}\) and \(\boldsymbol{\Lambda}\) as in \(\mathbf{A}=\mathbf{X} \boldsymbol{\Lambda} \mathbf{X}^{-1}\)(b) Take a singular value
For a linear equation set \(\left\{\begin{array}{c}x_{1}+x_{3}=1 \\ x_{2}=2 \\ -x_{2}=1\end{array}\right.\)(a) Form the least squares inverse;(b) Compute the model parameters using the generalized inverse;(c) Evaluate the resolution for the model in connection with the original equation set.
The Backus-Gilbert method has been applied to derive 3D phase or group velocity structures based on surface wave data. Describe how this is done by searching out and reading publications on this topic.
The damping factor \(\varepsilon^{2}\) in the minimum-norm LS solution (9-54) appears again in Section 9.5.3.1 on a priori information. Explain why the damping factor is able to preferentially suppress high-amplitude oscillations in the solution model. You are encouraged to explore this effect by
A joint inversion can be regarded as a constrained inversion, and vice versa. However, not all joint inversions achieve better results than separated inversions. Make a list of criteria for choosing a joint inversion over separated inversions.
Explain or refute a notion that in early days of reflection seismology people took -70 \(\mathrm{dB}\) as the noise level when there were no other references available.
Conduct a literature search to summarize the principles of ambient-noise seismology. What are the pros and cons?
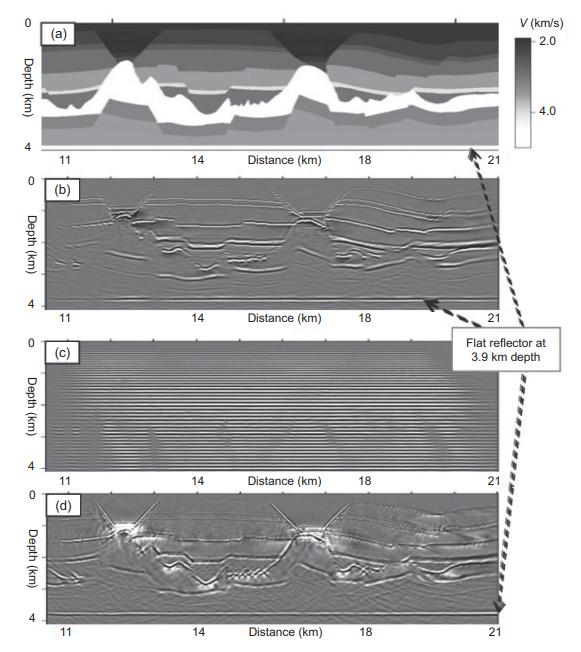
There are possible errors in the phase angle of the reflectors shown in panels (b) and (d) of Figure 10.7. How will you evaluate errors in the phase angle? What are your estimates of phase angle errors for these two panels?Figure 10.7 (a) Depth (km) 4 11 14 Distance (km) 18 (b) 0 Depth (km) V
Make a table to summarize major attributes of three groups of multiple suppression methods. The attribute list should include assumptions, principles, main method(s), applicable situations, and limitations.
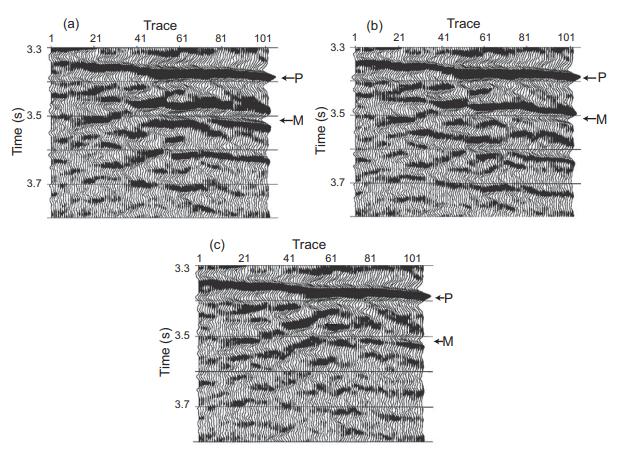
Come up with three different ways to quantify the effectiveness of the two multiple suppression methods shown in Figure 10.20, panels (b) and (c).Figure 10.20 Time (s) 3.7 3.5 3.3 (a) 21 Time (s) 3.7 3.5 41 Trace 61 81 101 3.3 (c)
Devise a way to construct a common image gather (CIG) using multiple reflections. What type of migration operator should be used? How will such a CIG differ from a CIG based on primaries?
Name several geologic settings that are suitable for HTI and VTI models, respectively. What are the impacts of HTI and VTI media on surface seismic reflection data? Comment on the effectiveness of using wellbore measurements to estimate HTI and VTI media.
Use a spreadsheet to compile a list of diagnostics for distinguishing velocity anisotropy from velocity heterogeneity using seismic and other geophysical and geologic information.
Prove via theoretical derivation or numerical calculation that a raypath in a homogeneous TI medium follows a straight line.
Compile in a table the criterion and diagnostics for recognizing a converted wave. Please specify the type of data, data domain, and principles of the recognition.
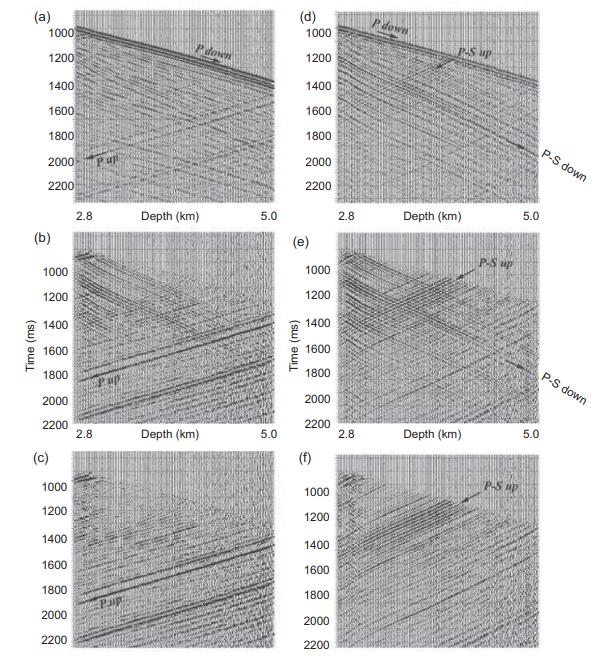
Conduct a literature search and summarize the idea and procedure of median filters that were used in Figure 10.51 to enhance upgoing reflections.Figure 10.51 (a) (d) 1000 Pdown PS up 1000 down 1200 1200 1400 1400 1600 1600 1800 1800 2000 2000- 2200 2200 P-S down 2.8 Depth (km) 5.0 2.8 Depth (km)
Section 8.4.2 described a simple case of tomographic inversion using first arrivals of VSP data. Prepare a data processing flowchart to build velocity model using first arrivals and traveltimes of different of reflection waves for a 2D walkaway VSP setup.
Discuss the sensitivity of the AVO attribute with respect to noise. List the measures that may help reduce the influences of various types of noise.
The amplitude of two time series \(\mathrm{S} 1\) and \(\mathrm{S} 2\) can be matched to a similar level by multiplying one of them by a constant \(a\). How would you determine the value of \(a\) in order to optimize the misfit between the two time series?
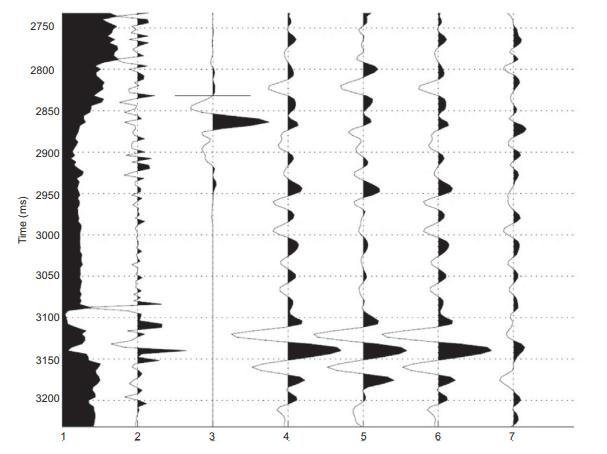
Describe two ways to quantify the seismic-to-well tie level. Write computer code to quantify the "similarity" between Trace 5 and Trace 6 in Figure 10.71 this can be done in Excel. Would you apply a variable weighting for different events?Figure 10.71 Time (ms) 2750 2800 2850 2900 2950 3000 3050
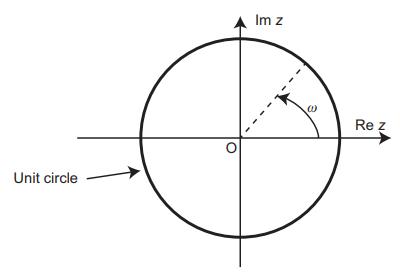
Along the unit circle in the complex \(z\)-plane shown in Figure 5.10, indicate the angle of:(a) Zero frequency;(b) Nyquist frequency;(c) \(100 \mathrm{~Hz}\) if the time sampling rate is \(4 \mathrm{~ms}\).Figure 5.10 Unit circle Im z Re z
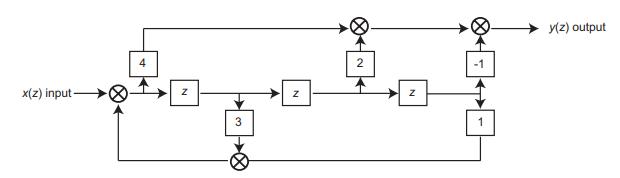
Find the \(z\)-transform formula and recursive formula of the filter whose block diagram is shown in Figure 5.11.Figure 5.11 x(z) input- N 3 Z 2 1 y(z) output
What type of filter is\[ y_{t}=\frac{1}{18} x_{t}-\frac{1}{6} x_{t-1}+\frac{1}{2} x_{t-2}+\frac{1}{2} y_{t-1}-\frac{1}{4} y_{t-2} ? \]For a signal sampled at 125 sample/second, at what frequency does this filter have its maximum effect?
For a seismic dataset sampled at \(2 \mathrm{~ms}\), design a minimum-phase and real-number filter that will suppress noise associated with \(\mathrm{AC}\) power at \(60 \mathrm{~Hz}\). What is the recursive formula of this filter?
For the following filter\[ f(z)=\frac{1.21+1.1 \sqrt{2} z+z^{2}}{1.44+1.2 \sqrt{2} z+z^{2}} \](a) Sketch the pole-zero locations and identify the filter type;(b) Sketch the amplitude response and label the frequency axis;(c) State the recursive formula;(d) Draw the block diagram.
The acquisition of seismic data for petroleum exploration usually applies a low-cut filter in the field. Find the reasons for using this low-cut filter by searching the literature.
A geophone is specified by a frequency, such as \(14 \mathrm{~Hz}, 4.5 \mathrm{~Hz}\), etc. What is the meaning of the specified frequency? Is it possible for a geophone to record signals of frequencies lower than its specified frequency?
Explain the benefit of using tapers in applying filtering in frequency domain. Is it possible to remove the entire Gibbs artifact associated with a DFT?
Frequency-wavenumber or \(f-k\) filtering is an effective way to remove linear noise. Please research this topic and then write a short report describing \(f-k\) filtering in terms of: (1) the idea; (2) application procedure; (3) pitfalls; and (4) an example.
Explain why a smooth transition between the rejection zone and pass zone is necessary in \(f-k\) filtering.
Explain or refute the following statement: For broad band input, the cross-correlation function of the input and output of a system is the impulse response of the system.
For a single seismic trace \(y(t)\) as the input, write a computer program (or a flowchart of descriptions) of the first five iterations of the inverse filtering method using the Levinson recursion.
The auto-covariance of a length-3 trace data trace \(y(z)\) is \((6,35,62,35,6)\).(a) Find the filter \(F(z)\) using the root method;(b) Form the Toeplitz normal equations;(c) Find the inverse filter \(A(z)\).(d) Is \(A(z)\) minimum phase? Compare it with \(F(z)\) and explain.
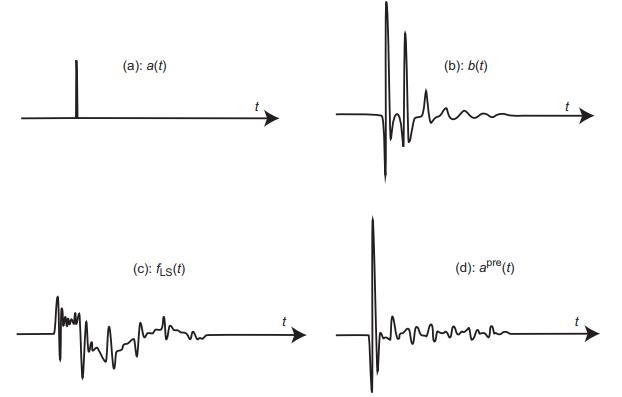
In the deconvolution example shown in Figure 5.29, the predicted signal shown in panel \((\mathrm{C})\) is much longer than the airgun signal in panel (B). Explain the origin of the long tails of the predicted signal.Figure 5.29 (): a(t) (b): b(t) (): fs(t) (d): apre (t)
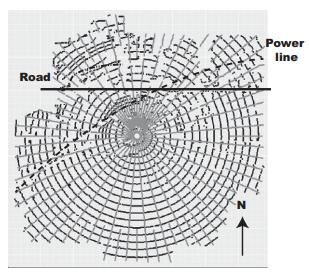
How would you estimate the fold, the number of the source-to-receiver midpoints in each CMP bin, from a survey map like that shown in Figure 1.6? Describe your procedure and assumptions.Figure 1.6 Road Power line N
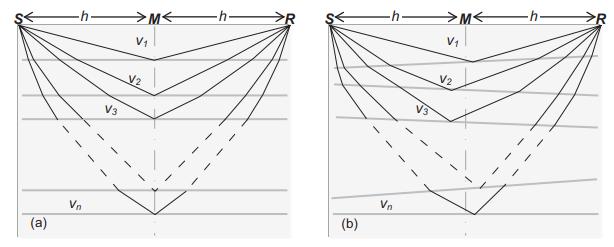
As shown in Figure 1.7, the shapes of reflection raypaths tend to resemble the letter “U” rather than the letter “V”. Explain the reason behind this phenomenon.Figure 1.7 -h. V3 M < -h R >M < -h R V V2 (a) Vn (b) Vn V2
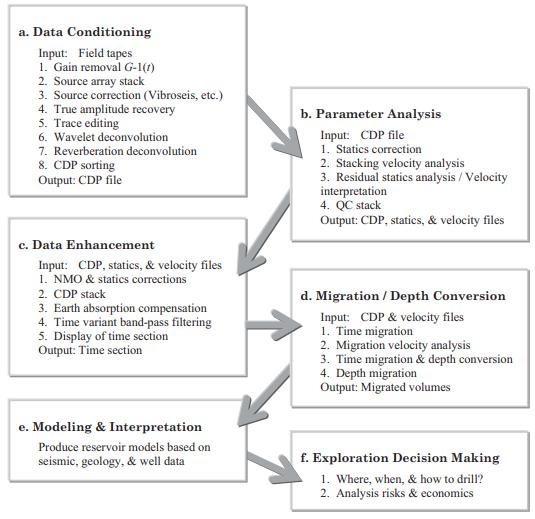
Update the processing flow shown in Figure 1.8 by finding and reading at least two papers published within the past 10 years. What happened to those processing steps in Figure 1.8 that are missing from your updated processing flow?Figure 1.8 a. Data Conditioning Input: Field tapes 1. Gain removal
A given seismic trace is sampled at 4 milliseconds. If the signal frequency is known to be up to 60 Hz, find a way to reduce the total number of sampling points without losing the signal.
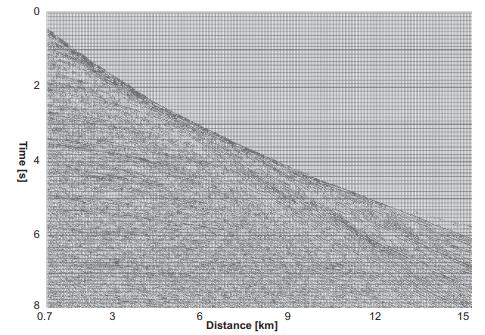
In Figure 1.9 try to identify as many of the seismic events as you can. What are the main primary reflection events? What are the factors affecting the amplitudes of seismic events in this figure?Figure 1.9 0 2 + Time [s] 6 8 0.7 3 6 Distance [km] 9 12 15
In your own words, define the following terms: signal, time series, z-transform, processing artifact, and spatial aliasing.
Find an example of AGC in seismic data processing from the literature. What was the gain function used and what was the reason for it?
In Figure 1.14 why do the panels with lower central frequencies have smoother radiation patterns? What was the likely orientation of the airgun array and why?Figure 1.14 80 60 40 40 80 Frequency: 10 Hz 80 80 40/30 20 40 40 80 Array depth: 9 m dB T T 0 -12-24 -36 40 40 80 Frequency: 30 Hz 401 40 80
Search the literature to find the basic physical principles for the use of AVO to detect fluid properties in subsurface. Why is AGC not allowed in AVO studies?
When a time series is reversed, what happens to its phase properties? Demonstrate your point using the time series (1, 2, 3, 4).
How can the phase of a seismic trace be advanced by 30°? How can it be advanced by any degree?
Describe the generalized Hilbert transform (GHT) after reading Luo et al., 2003.
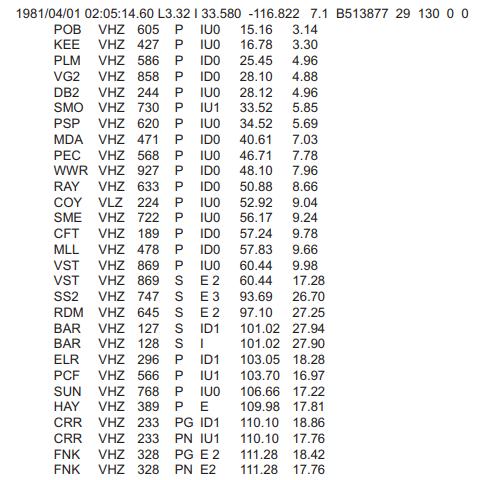
Find out the meanings of the values in the earthquake phase data example shown in Figure 1.23.Figure 1.23 1981/04/01 02:05:14.60 L3.32 I 33.580 -116.822 7.1 B513877 29 130 0 0 POB VHZ 605 P IUO 15.16 3.14 KEE VHZ 427 P IUO 16.78 3.30 PLM VHZ 586 P IDO 25.45 4.96 VG2 VHZ 858 P IDO 28.10 4.88 DB2 VHZ
Many data sorting procedures can be carried out by sorting the data headers. Why is this approach efficient? Can you give examples to illustrate your arguments?
Write a flow chart of the processing steps required to convert a seismic dataset in CSG arrangement into CMP arrangement, assuming that the data are in SEGY format. Try to write the processes and parameter values in as much detail as possible.
Search the literature to find typical surface seismic survey geometry onshore and offshore, and the typical ranges of parameters such as source depths, receiver depths, source-to-receiver offsets, source-to-receiver azimuths, sample rates, data frequencies, and recording lengths. The results may be
Use your own words to define the concepts of: demultiplexing, time stack, matched filter, and walkaway RVSP.
If we have multi-component surface reflection data, can we use a hodogram to suppress ground rolls? How would you do it? What problems can you anticipate for your approach?
Prove or refute the statement that stacking of seismic traces has the effect of low-pass filtering.
Most semblance velocity analysis stacks all traces with equal weight. Should we apply variable weights as a function of offset and intersection time? Devise a way to conduct such a weighted semblance stack process. It would be great if you could write a program to realize the process.
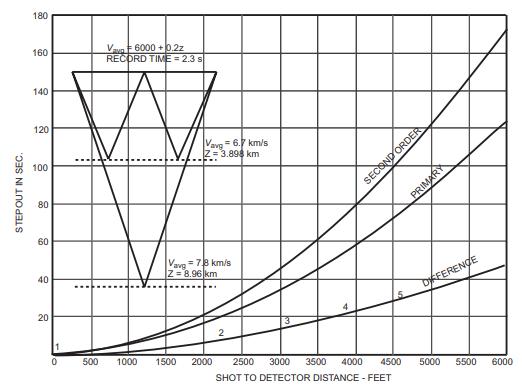
The semblance velocities of multiple reflections are usually slower than the velocity of the primary reflection, as shown in Figure 2.8. Explain the reasons behind this observation.Figure 2.8 STEPOUT IN SEC. 180 160 V6000 +0 27 RECORD TIME 2.3 s 140 120 100 Vavg-6.7 km/s Z=3.898 km 80 60 20 40 Vavg
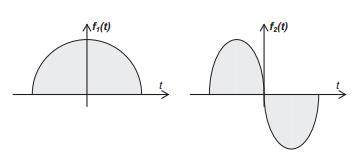
Sketch the cross-correlation of two functions with equal time durations in Figure 2.13. you may first discretize the functions into short time series, and then use the formula of discrete cross-correlation.Figure 2.13 pf,(t) Mf(t)
Compare and contrast the convolution and cross-correlation operations. It may be best to organize your answer by using a table listing the similarities and differences.
Cross-correlation is used to measure the similarity between two vectors \(\mathbf{u}=\left(u_{1}\right.\), \(\left.u_{2}, \ldots, u_{N}\right)\) and \(\mathbf{v}=\left(v_{1}, v_{2} \ldots, v_{N}\right)^{\mathrm{T}}\). By removing the averages \(\bar{u}\) and \(\bar{v}\), we obtain residual vectors
Define white noise versus colored noise, and give several examples for each type of noise. Why is it usually more difficult to suppress colored noise than white noise?
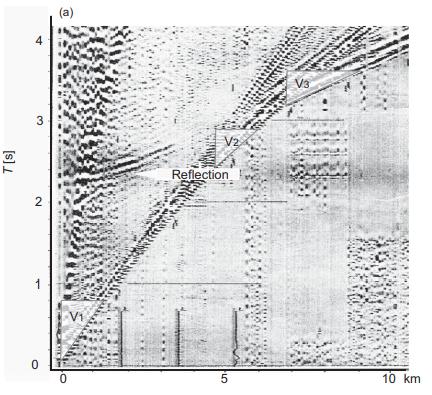
Discuss the meanings of signals and noise in Figures 2.14a and 2.15a.Figures 2.14aFigures 2.15a T[s] 0 3 (a) 2 V2 Reflection 1 V1 V3 0 5 10 km
Find a couple of examples in the literature on noise suppression in seismic data processing using the \(\tau-p\) transform.
Showing 100 - 200
of 304
1
2
3
4
Step by Step Answers