

We report the average years of education for a subsample of GSS 2014 respondents by their social
Question:
We report the average years of education for a subsample of GSS 2014 respondents by their social class— lower, working, middle, and upper. Standard deviations are also reported for each class.
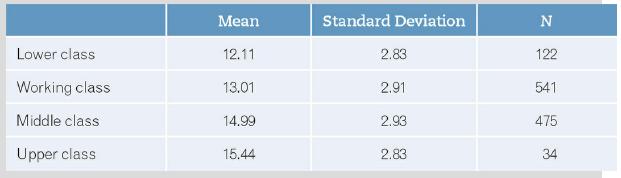
1. Assuming that years of education is normally distributed in the population, what proportion of working-class respondents have 12 to 16 years of education? What proportion of upper-class respondents have 12 to 16 years of education?
2. What is the probability that a working-class respondent, drawn at random from the population, will have more than 16 years of education? What is the equivalent probability for a middle-class respondent drawn at random?
3. What is the probability that a lower-class respondent will have less than 10 years of education?
4. If years of education is actually positively skewed in the population, how would that change your other answers?
Step by Step Answer:
The formulae used to calcul...View the full answer


Social Statistics For A Diverse Society
ISBN: 9781506347202
8th Edition
Authors: Chava Frankfort Nachmias, Anna Y. Leon Guerrero
