

Question: 7.51 Pizza preference with p 0.6 Refer to the previous two exercises but now suppose the population proportion in Boston preferring pizza A is p
7.51 Pizza preference with p 0.6 Refer to the previous two exercises but now suppose the population proportion in Boston preferring pizza A is p = 0.6 instead of p = 0.5. (Then, the eight possible outcomes (AAA, AAD, . . . , DDA, DDD) of a sample of size n = 3 are not equally likely, as in part b of Exercise 7.49)
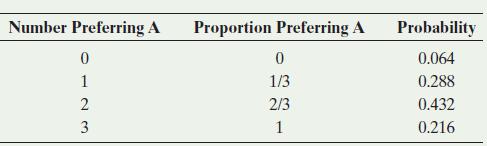
a. Use the binomial distribution to verify that the sampling distribution of the sample proportion in a sample of size n = 3 is given by
(Note: Using the binomial distribution, you can, in principle, find the sampling distribution for the sample proportion for any n and p.)
b. When n = 100, what is the mean number of persons that prefer pizza A in a sample of size n = 100?
(Hint: Use the formula for the mean of a binomial distribution.)
c. Part b found the mean number (or expected value)
of persons preferring pizza A in a sample of size 100.
What then is the expected proportion of persons preferring pizza A in a sample of size 100? This is the mean of the sampling distribution of the sample proportion.
Number Preferring A Proportion Preferring A Probability 0123 0 0 0.064 1/3 0.288 2/3 0.432 1 0.216
Step by Step Solution
There are 3 Steps involved in it

Get step-by-step solutions from verified subject matter experts