

Question: 7.52 Simulating pizza preference with p 0.5 Access the Sampling Distribution of the Sample Proportion web app. a. For p = 0.5 and a sample
7.52 Simulating pizza preference with p 0.5 Access the Sampling Distribution of the Sample Proportion web app.
a. For p = 0.5 and a sample of size n = 3, the graph of the sampling distribution is given below. (This is the graph corresponding to the table in Exercise 7.49, part b.) Compute the mean of the sampling distribution from first principles, i.e., using the formula gxP1X = x2. The standard deviation of the sampling distribution is equal to 0.289.
b. Now, using the app, simulate the sampling distribution for a population proportion when p = 0.5 and n = 3, using 10,000 simulations. Do the graph and the results from the simulations agree? Compare the shapes, means, and standard deviations from the two graphs. (The mean and standard deviation of the 10,000 generated sample proportions are displayed in the title of the graph for the sampling distribution in the app.)
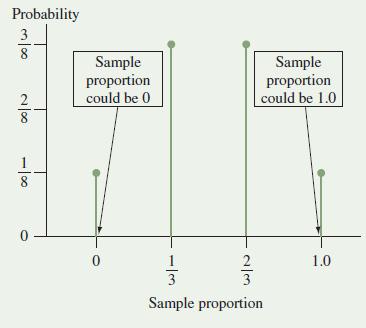
Probability 3100 8 28 Sample proportion could be 0 Sample proportion could be 1.0 18 0 0 3 23 1.0 10 23 Sample proportion
Step by Step Solution
There are 3 Steps involved in it

Get step-by-step solutions from verified subject matter experts