

Question: (Scatterplots, Correlation, and the Regression Line) The data from Example 2.17 give the front and rear leg rooms (in inches) for 10 different compact sports
(Scatterplots, Correlation, and the Regression Line) The data from Example 2.17 give the front and rear leg rooms (in inches) for 10 different compact sports utility vehicles:
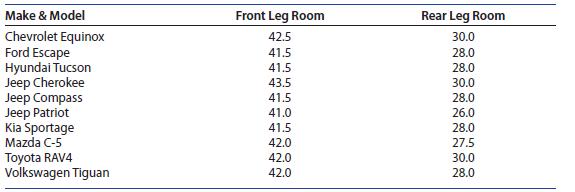
1. If you did not save the MINITAB worksheet from Chapter 2, enter the data into the first three columns of another MINITAB worksheet, using the labels in the table. To examine the relationship between the front and rear leg rooms, you can plot the data and describe the relationship with the correlation coefficient and the best-fitting line.
2. Select Stat ➤ Regression ➤ Fitted Line Plot, and select “Front Leg Room” and “Rear Leg Room” for Y and X, respectively (see Figure 3.17(a)). Make sure that the radio button next to Linear is selected, and click OK. The plot of the nine data points and the best-fitting line will be generated as in Figure 3.17(b).
Make & Model Chevrolet Equinox Front Leg Room Rear Leg Room Ford Escape Hyundai Tucson 42.5 41.5 30.0 28.0 41.5 28.0 Jeep Cherokee Jeep Compass Jeep Patriot Kia Sportage 43.5 30.0 41.5 28.0 41.0 26.0 41.5 28.0 Mazda C-5 42.0 27.5 Toyota RAV4 42.0 30.0 Volkswagen Tiguan 42.0 28.0
Step by Step Solution
There are 3 Steps involved in it

Get step-by-step solutions from verified subject matter experts