

Question: The MINITAB and MS Excel outputs were generated for a multiple linear regression analysis. What model has been fitted to the data, and what is
The MINITAB and MS Excel outputs were generated for a multiple linear regression analysis. What model has been fitted to the data, and what is the least-squares prediction equation?
Fill in the blanks in the ANOVA table and use it to test for a significant regression using a =.05.
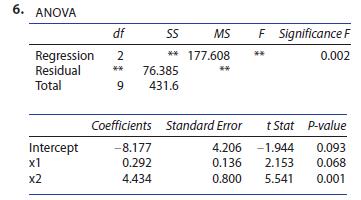
6. ANOVA df SS MS F Significance F Regression 2 ** 177.608 ** 0.002 Residual ** 76.385 ** Total 9 431.6 Coefficients Standard Error t Stat P-value Intercept -8.177 4.206 -1.944 0.093 x1 0.292 0.136 2.153 0.068 x2 4.434 0.800 5.541 0.001
Step by Step Solution
There are 3 Steps involved in it
1 Expert Approved Answer
Step: 1 Unlock

Question Has Been Solved by an Expert!
Get step-by-step solutions from verified subject matter experts
Step: 2 Unlock
Step: 3 Unlock