

Question: The MINITAB and MS Excel outputs were generated for a multiple linear regression analysis. What model has been fitted to the data, and what is
The MINITAB and MS Excel outputs were generated for a multiple linear regression analysis. What model has been fitted to the data, and what is the least-squares prediction equation?
Fill in the blanks in the ANOVA table and use it to test for a significant regression using a =.05.
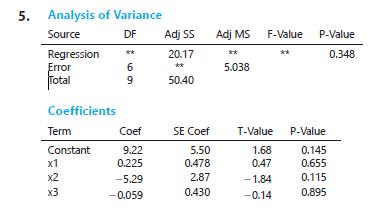
5. Analysis of Variance DF Adj SS Adj MS F-Value P-Value 20.17 ** ** 0.348 Source Regression ** Error Total Coefficients 6 5.038 9 50.40 Term Coef SE Coef T-Value P-Value Constant 9.22 5.50 1.68 0.145 x1 0.225 0.478 0.47 0.655 x2 -5.29 2.87 -1.84 0.115 x3 -0.059 0.430 -0.14 0.895
Step by Step Solution
There are 3 Steps involved in it
1 Expert Approved Answer
Step: 1 Unlock

Question Has Been Solved by an Expert!
Get step-by-step solutions from verified subject matter experts
Step: 2 Unlock
Step: 3 Unlock