

The Olympic winning mens long jump distances (in meters) from 1896 to 2016 and the fitted regression
Question:
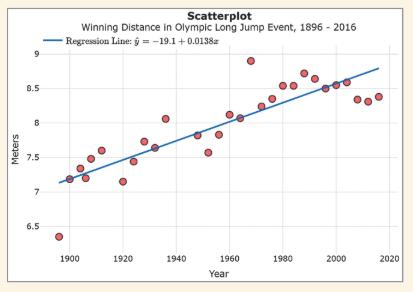
The Olympic winning men’s long jump distances (in meters) from 1896 to 2016 and the fitted regression line for predicting them using x = year are displayed in the following graph.
a. Identify an observation that may influence the fit of the regression line. Why did you identify this observation?
b. Which do you think is a better prediction for the year 2020—the sample mean of the y values in this plot or the value obtained by plugging 2020 into the fitted regression equation?
c. Would you feel comfortable using the regression line shown to predict the winning long jump for men in the year 2060? Why or why not?
Step by Step Answer:

This question has not been answered yet.
You can Ask your question!

Statistics The Art And Science Of Learning From Data
ISBN: 9781292444765
5th Global Edition
Authors: Alan Agresti, Christine A. Franklin, Bernhard Klingenberg
