

Question: A college dean would like to know how well he can predict sophomore grade point average for first semester freshmen so that students who are
A college dean would like to know how well he can predict sophomore grade point average for first semester freshmen so that students who are headed for trouble can be given appropriate counseling. After students have been in school for one semester, the dean obtains their numerical final examination average for the first semester (based on a total of 100 points) and the average number of €œcuts€ per class during the semester. He then waits for a year and a half, and when the students have finished their second year, he obtains their sophomore grade point average. To keep the computations down to a reasonable level, we will assume that the dean has a sample of only seven cases. (Note that in a real study of this kind there would be many more participants, but the same procedures would be used.)
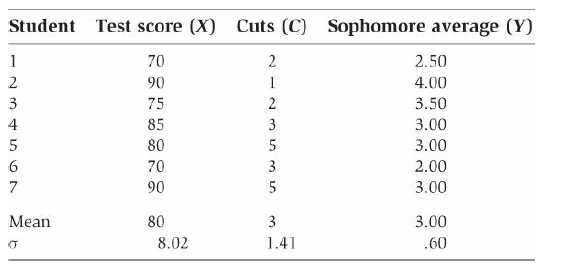
a. Convert the test scores (X) and sophomore averages (Y) to z scores. By inspection of the paired z scores, estimate whether the correlation between these two variables is strong and positive, about zero, or strong and negative. Then verify your estimate by computing r using the z score product formula.
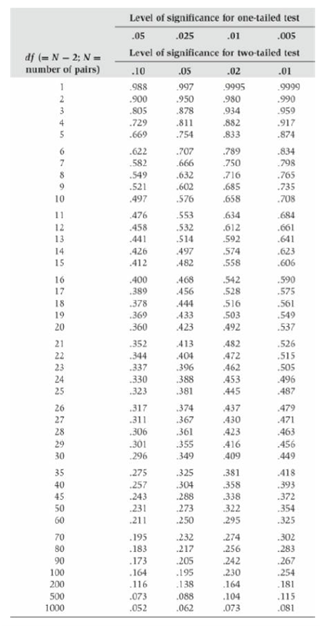
b. Use (raw-score) Formula 9.2 to compute the Pearson r between the number of cuts (C) and the sophomore average (Y). Can you reject the null hypothesis at the .05 level with a two-tailed test? (Use Table C.)
c. Repeat part (b) for the correlation between the number of cuts (C) and the test score (X). Is this correlation significant at the .01 level with a one-tailed test?
Formula 9.2
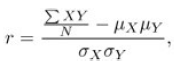
Table C
Student Test score (X) Cuts (C) Sophomore average (Y) 70 2.50 90 1 4.00 75 2 3.50 85 3.00 4 3 80 3.00 2.00 70 3 90 3.00 3.00 Mean 80 3 8.02 1.41 .60
Step by Step Solution
3.28 Rating (157 Votes )
There are 3 Steps involved in it
a This is a highly positive correlation which tells ... View full answer

Get step-by-step solutions from verified subject matter experts