

Question: 69. The box plot below shows the amount spent for books and supplies per year by students at community colleges: a. Estimate the median amount
69. The box plot below shows the amount spent for books and supplies per year by students at community colleges:
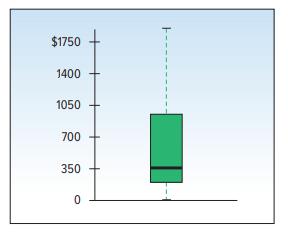
a. Estimate the median amount spent.
b. Estimate the first and third quartiles for the amount spent.
c. Determine the interquartile range for the amount spent.
d. Beyond what point is a value considered an outlier?
e. Identify any outliers and estimate their value.
f. Is the distribution symmetric or positively or negatively skewed?
$1750 1400 1050 700 350 0
Step by Step Solution
There are 3 Steps involved in it
1 Expert Approved Answer
Step: 1 Unlock

Question Has Been Solved by an Expert!
Get step-by-step solutions from verified subject matter experts
Step: 2 Unlock
Step: 3 Unlock