

R. Dornbusch and S. Fischer (in R.E. Caves and L.B. Krause, Britains Economic Performance, Brookings, 1980) report
Question:
R. Dornbusch and S. Fischer (in R.E. Caves and L.B. Krause, Britain’s Economic Performance, Brookings, 1980) report the following equation for predicting the UK balance of payments:
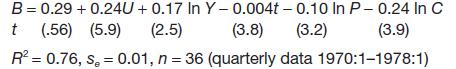
where
B: the current account of the balance of payments as a percentage of gross domestic product (a balance of payments deficit of 3% of GDP would be recorded as −3.0, for example)
U: the rate of unemployment
Y: the OECD index of industrial production
t: a time trend
P: the price of materials relative to the GDP deflator (price index)
C: an index of UK competitiveness (a lower value of the index implies greater competitiveness)
(ln indicates the natural logarithm of a variable)
(a) Explain why each variable is included in the regression. Do they all have the expected sign for the coefficient?
(b) Which of the following lead to a higher BOP deficit (relative to GDP): (i) higher unemployment; (ii) higher OECD industrial production; (iii) higher material prices; (iv) greater competitiveness?
(c) What is the implied shape of the relationship between B and (i) U, (ii) Y?
(d) Why cannot a double log equation be estimated for this data? What implications does this have for obtaining elasticity estimates? Why are elasticity estimates not very useful in this context?
(e) Given the following values of the explanatory variables, estimate the state of the current account (point estimate): unemployment rate = 10%, OECD index = 110, time trend = 37, materials price index = 100, competitiveness index = 90.
Step by Step Answer:
Answer a U Unemployment rate is included in the regression because it affects the balance of payments through its impact on domestic demand and competitiveness If unemployment is high domestic demand ...View the full answer


Statistics For Economics Accounting And Business Studies
ISBN: 978027368308
4th Edition
Authors: Michael Barrow
