

The following data show expenditure on the National Health Service (in cash terms), the GDP deflator, the
Question:
The following data show expenditure on the National Health Service (in cash terms), the GDP deflator, the NHS pay and prices index, population, and population of working age:
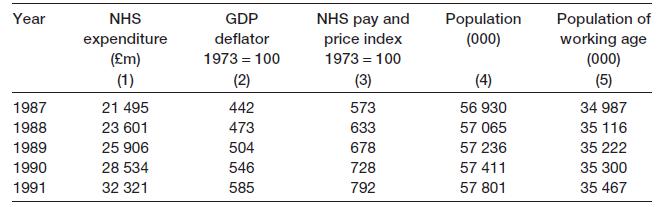
(In all the following answers, set your index to 1987 = 100.)
(a) Turn the expenditure cash figures into an index number series.
(b) Calculate an index of ‘real’ NHS expenditure using the GDP deflator. How does this alter the expenditure series?
(c) Calculate an index of the volume of NHS expenditure using the NHS pay and prices index. How and why does this differ from the answer arrived at in (b)?
(d) Calculate indices of real and volume expenditure per capita. What difference does this make?
(e) Suppose that those not of working age cost twice as much to treat, on average, as those of working age. Construct an index of the need for health care and examine how health care expenditures have changed relative to need.
(f) How do you think the needs index calculated in (e) could be improved?
Step by Step Answer:
a To turn the expenditure cash figures into an index number series we need to set the index of 1987 to 100 and then calculate the index for each subsequent year using the formula Index Value of Curren...View the full answer


Statistics For Economics Accounting And Business Studies
ISBN: 978027368308
4th Edition
Authors: Michael Barrow
