

Question: The article Optimization of Medium Composition for Lipase Production by Candida rugosa NCIM 3462 Using Response Surface Methodology (A. Ragendran and V. Thangavelu, Can J.
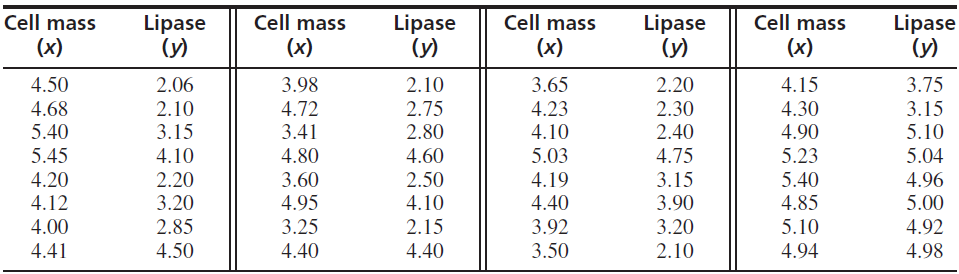
a. Compute the least-squares line for predicting lipase production from cell mass.
b. Compute 95% confidence intervals for β0 and β1.
c. In two experiments, the cell masses differed by 1.5 g/L. By how much do you estimate that their lipase productions will differ?
d. Find a 95% confidence interval for the mean lipase production when the cell mass is 5.0 g/L.
e. Can you conclude that the mean lipase production when the cell mass is 5.0 g/L is less than 4.4? Explain.
Lipase Lipase Cell mass Cell mass Cell mass Cell mass Lipase (y) Lipase (y) (x) (y) (x) (x) (x) (y) 3.75 3.98 4.72 4.50 2.06 2.10 3.65 4.23 2.20 4.15 4.30 2.10 3.15 4.10 2.75 2.30 2.40 4.75 3.15 4.68 3.15 5.40 3.41 2.80 4.10 5.03 4.90 5.23 5.10 4.60 2.50 5.04 4.96 5.45 4.80 2.20 3.20 2.85 4.20 3.60 4.95 3.25 4.19 5.40 4.85 4.12 4.10 4.40 3.92 3.90 5.00 4.00 2.15 3.20 5.10 4.94 4.92 4.98 4.41 4.50 4.40 4.40 3.50 2.10
Step by Step Solution
3.33 Rating (174 Votes )
There are 3 Steps involved in it
a b There are 32 2 30 degrees of freedom t 30025 2042 Therefore a 95 confidence interval for 0 is 21... View full answer

Get step-by-step solutions from verified subject matter experts