

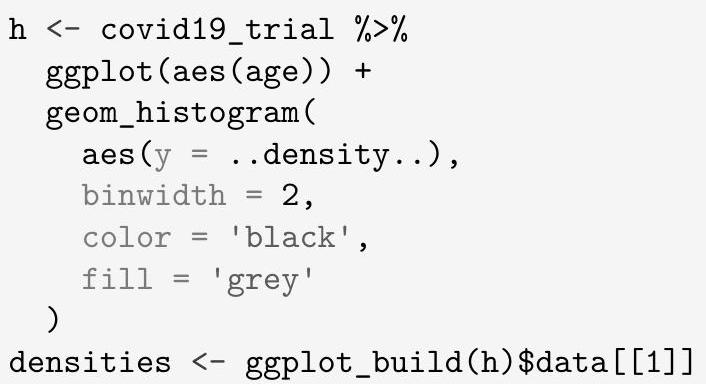
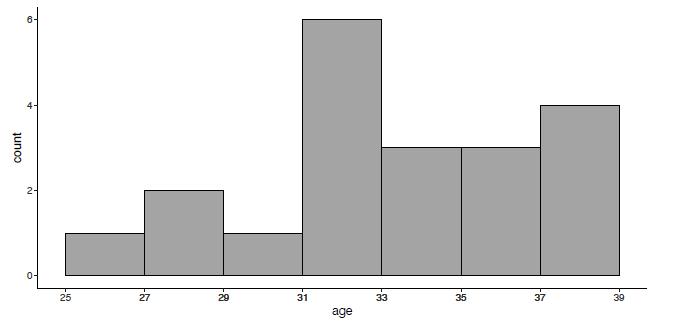
Reproduce Figure 2.4 using geom_histogram(aes(y = ..density..)) as shown below for Example 2.5. ggplot_build() extracts the computed
Question:
Reproduce Figure 2.4 using geom_histogram(aes(y = ..density..)) as shown below for Example 2.5. ggplot_build() extracts the computed values for the histogram. Use the extracted vales to confirm that the areas of all bars of the density histogram sum up to 1 .
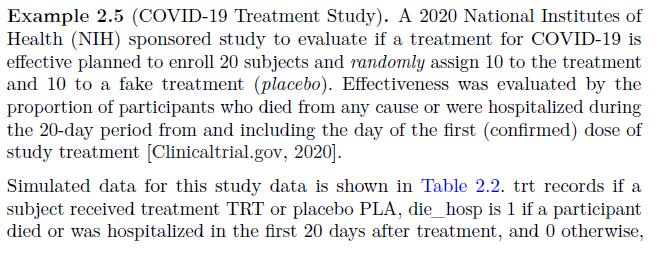
Data from Example 2.5
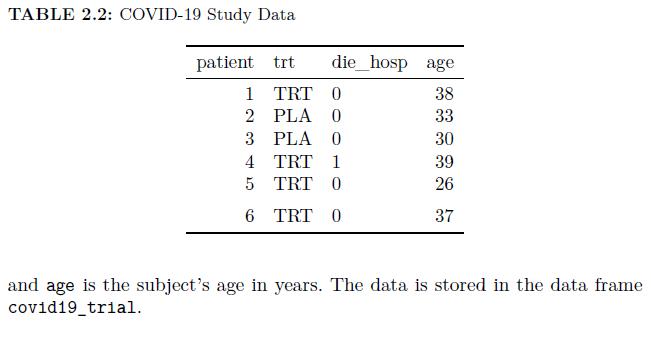
Data from Figure 2.4
Fantastic news! We've Found the answer you've been seeking!
Step by Step Answer:

Answered By
PRINCE PANDEY
I am Indian Chartered Accounting having a strong hold in the subjects of Accounting, IFRS Reporting, Indian
Taxation, Cost Accounting, Auditing. I have vast experience of teaching a student with easy way problem-solving approach.
1+ Reviews
10+ Question Solved
Related Book For 
Design And Analysis Of Experiments And Observational Studies Using R
ISBN: 9780367456856
1st Edition
Authors: Nathan Taback
Question Posted:
