

The treatment assignment displayed in Table 2.5 is from one treatment assignment out of $left(begin{array}{l}20 10end{array}
Question:
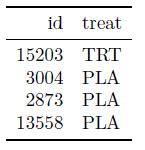
The treatment assignment displayed in Table 2.5 is from one treatment assignment out of $\left(\begin{array}{l}20 \\ 10\end{array}\right)$ possible random treatment assignments. a. $\mathrm{R}$ can be used to generate all possible combinations of 10 patients assigned to the treatment group using combn(covid_sample\$id, 10). Use the command to generate the combinations and confirm that there are $\left(\begin{array}{l}20 \\ 10\end{array}\right)$ ways to generate the treatment assignments.
b. To generate the random array of treatment assignments in Table 2.5, $\mathrm{R}$ was used to randomly select 10 patients for the active treatment first and then assigned the placebo to the remaining 10 . We can also generate a random treatment assignment vector by randomly selecting a column fromthe matrix of all possible treatment assignments created in part a. In R, randomly select a column and assign the first 10 to the active treatment and the rest to the placebo. Repeat a few times and discuss whether the procedure results in random assignments as desired. (Hint: You can use if_else(condition, true, false) inside mutate to return true when condition is met and false otherwise.)
c. Another scheme we may consider is to assign TRT or PLA to each patient with equal probabilities independently. Implement the procedure in R. Repeat a few times and discuss whether the procedure results in random assignments as desired.
d. Can you think of another procedure in $\mathrm{R}$ for randomly assigning 10 patients to active treatment? Implement your own procedure in $R$ to verify the procedure results in random assignments.
Data from Table 2.5
Step by Step Answer:


Design And Analysis Of Experiments And Observational Studies Using R
ISBN: 9780367456856
1st Edition
Authors: Nathan Taback
