

A manufacturer of computer terminal fuses wants to establish a control chart to monitor the production process.
Question:
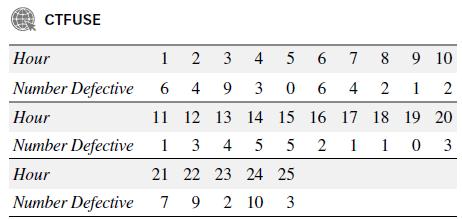
A manufacturer of computer terminal fuses wants to establish a control chart to monitor the production process. Each hour, for a period of 25 hours, during a time when the process is known to be in control, a quality control engineer randomly selected and tested 100 fuses from the production line. The number of defective fuses found each hour is recorded in the table.
a. Construct a p-chart for the sample percentage of defective terminal fuses.
b. Locate the center line on the p-chart.
c. Locate upper and lower control limits on the p-chart. Does the process appear to be in control?
d. Conduct a runs analysis on the points on the p-chart. What does this imply?
e. Suppose the next sample of 100 terminal fuses selected from the production line contains 11 defectives. Is the process now out of control? Explain.
Step by Step Answer:


Statistics For Engineering And The Sciences
ISBN: 9781498728850
6th Edition
Authors: William M. Mendenhall, Terry L. Sincich
