

Question: Construct an R-chart for the data of Exercise 16.15. Does the process variation appear to be in control? Data from Exercise 16.15 Refer to the
Construct an R-chart for the data of Exercise 16.15. Does the process variation appear to be in control?
Data from Exercise 16.15
Refer to the manufacture of a rheostat knob, Exercise 16.7. To monitor the process mean, five knobs from each hour’s production were randomly sampled and the distance from the back of the knob to the far side of a pin hole was measured on each. The measurements (in inches) for the first 27 hours the process was in operation are shown in the table below.
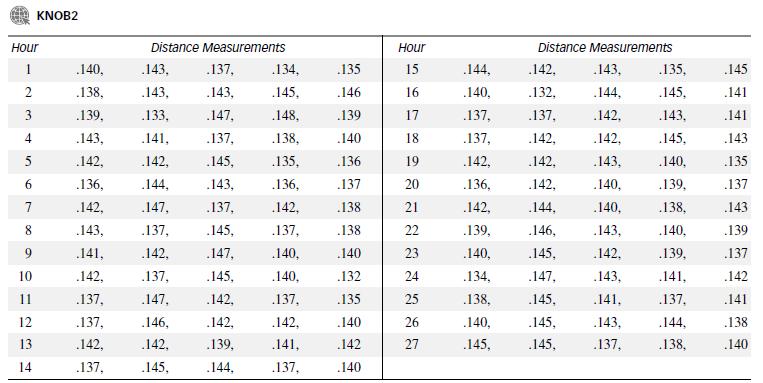
Data from Exercise 16.7
A rheostat knob, produced by plastic molding, contains a metal insert. The fit of this knob into its assembly is determined by the distance from the back of the knob to the far side of a pin hole. To monitor the molding operation, one knob from each hour’s production was randomly sampled and the dimension measured on each. The next table (p. 896) gives the distance measurements (in inches) for the first 27 hours the process was in operation.
KNOB2 Hour Distance Measurements Hour Distance Measurements 1 .140, .143, .137, .134, .135 15 .144, .142. .143, .135, .145 2 .138, .143, .143, .145, .146 16 .140, .132, .144, .145, .141 3 .139, .133, .147, .148, .139 17 .137, .137, .142, .143, .141 4 .143, .141, .137, .138, .140 18 .137, .142, .142, .145, .143 5 .142, .142, .145, .135, .136 19 .142, .142, .143, .140, .135 .136, .144, .143, .136, .137 20 .136, .142, .140, .139, .137 7 .142, 147, .137, .142, .138 21 .142, .144, .140, .138, .143 8. .143, .137, .145, .137, .138 22 .139, .146, .143, .140, .139 9 .141, .142, .147, .140, .140 23 .140, .145, .142, .139, .137 10 .142, .137, .145, .140, .132 24 .134, .147, .143, .141, .142 11 .137, 147, .142, .137, .135 25 .138, .145, .141, .137, .141 12 .137, .146, .142, .142, .140 26 .140, .145, .143, .144, .138 13 .142, .142, .139, .141, .142 27 .145, .145, .137, .138, .140 14 .137, .145, .144, .137, .140
Step by Step Solution
3.61 Rating (173 Votes )
There are 3 Steps involved in it

Get step-by-step solutions from verified subject matter experts