

Question: Refer to Exercise 10.12 and the simple linear regression relating the sweetness index (y) of an orange juice sample to the amount of water soluble
Refer to Exercise 10.12 and the simple linear regression relating the sweetness index (y) of an orange juice sample to the amount of water soluble pectin (x) in the juice. Find a 90% confidence interval for the true slope of the line. Interpret the result.
Data from Exercise 10.12
The quality of the orange juice produced by a manufacturer (e.g., Minute Maid, Tropicana) is constantly monitored. There are numerous sensory and chemical components that combine to make the best tasting orange juice. For example, one manufacturer has developed a quantitative index of the “sweetness” of orange juice (the higher the index, the sweeter the juice). Is there a relationship between the sweetness index and a chemical measure such as the amount of water-soluble pectin (parts per million) in the orange juice? Data collected on these two variables for 24 production runs at a juice manufacturing plant are shown in the next table. Suppose a manufacturer wants to use simple linear regression to predict the sweetness (y) from the amount of pectin (x).
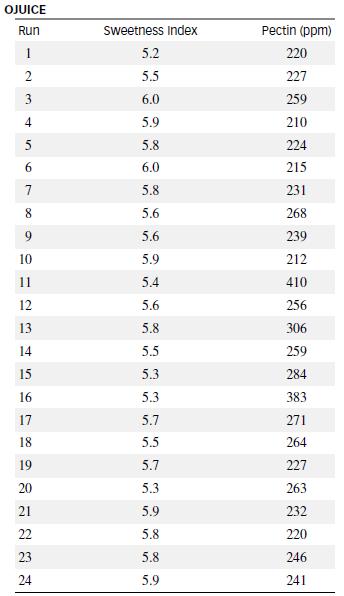
OJUICE Run sweetness Index Pectin (ppm) 1 5.2 220 5.5 227 6.0 259 4 5.9 210 5 5.8 224 6. 6.0 215 7 5.8 231 8. 5.6 268 5.6 239 10 5.9 212 11 5.4 410 12 5.6 256 13 5.8 306 14 5.5 259 15 5.3 284 16 5.3 383 17 5.7 271 18 5.5 264 19 5.7 227 20 5.3 263 21 5.9 232 22 5.8 220 23 5.8 246 24 5.9 241
Step by Step Solution
3.36 Rating (183 Votes )
There are 3 Steps involved in it

Get step-by-step solutions from verified subject matter experts