

Question: The data in Table 13 represent the five-year rate of return of a random sample of 40 large-blended mutual funds. Approximate the standard deviation of
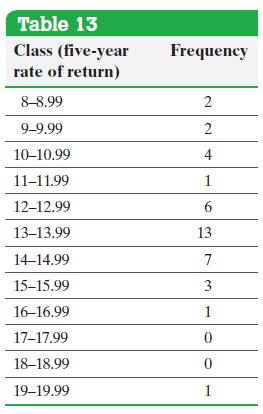
The data in Table 13 represent the five-year rate of return of a random sample of 40 large-blended mutual funds. Approximate the standard deviation of the five-year rate of return.
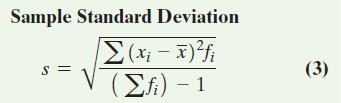
Approach Use the sample standard deviation Formula (3).
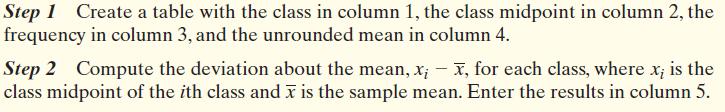
Step 1 Create a table with the class in column 1, the class midpoint in column 2, the frequency in column 3, and the unrounded mean in column 4. Step 2 Compute the deviation about the mean, x; - x, for each class, where x, is the class midpoint of the ith class and x is the sample mean. Enter the results in column 5.
Step by Step Solution
3.48 Rating (158 Votes )
There are 3 Steps involved in it
Step 1 Create Table 15 Column 1 contains the classes Column 2 cont... View full answer

Get step-by-step solutions from verified subject matter experts