

Question: The frequency distribution in Table 13 represents the five-year rate of return of a random sample of 40 large-blended mutual funds. Approximate the mean fiveyear
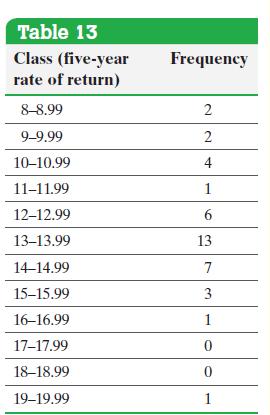
The frequency distribution in Table 13 represents the five-year rate of return of a random sample of 40 large-blended mutual funds. Approximate the mean fiveyear rate of return.
Approach
Step 1 Determine the class midpoint of each class by adding consecutive lower class limits and dividing the result by 2.
Step 2 Compute the sum of the frequencies, ∑fi.
Step 3 Multiply the class midpoint by the frequency to obtain xi fi for each class.
Step 4 Compute ∑xi fi.
Step 5 Substitute into Sample Mean Formula (1) to obtain the mean from grouped data.
Sample Mean Formula 1
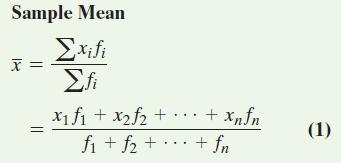
Table 13 Class (five-year rate of return) Frequency 8-8.99 2 9-9.99 2 10-10.99 4 11-11.99 1 12-12.99 6 13-13.99 13 14-14.99 7 15-15.99 3 16-16.99 1 17-17.99 0 18-18.99 0 19-19.99 1
Step by Step Solution
3.40 Rating (163 Votes )
There are 3 Steps involved in it

Get step-by-step solutions from verified subject matter experts