

The data in Table 7 represent the IQ scores of a random sample of 100 students from
Question:
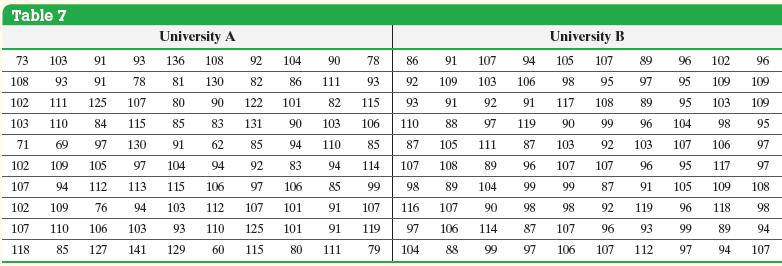
The data in Table 7 represent the IQ scores of a random sample of 100 students from two different universities. For each university, compute the mean IQ score and draw a histogram using a lower class limit of 55 for the first class and a class width of 15. Comment on the results.
Approach We will use Minitab to compute the mean and draw a histogram for each university.
Fantastic news! We've Found the answer you've been seeking!
Step by Step Answer:
Enter the data into Minitab and determine that the mean ...View the full answer

Answered By
Susan Juma
I'm available and reachable 24/7. I have high experience in helping students with their assignments, proposals, and dissertations. Most importantly, I'm a professional accountant and I can handle all kinds of accounting and finance problems.
15+ Reviews
45+ Question Solved
Related Book For 

Statistics Informed Decisions Using Data
ISBN: 9781292157115
5th Global Edition
Authors: Michael Sullivan
Question Posted:
