

Question: The data in Table 8 represent the scores on the first exam of 10 students enrolled in Introductory Statistics. Compute the range. Approach The range
The data in Table 8 represent the scores on the first exam of 10 students enrolled in Introductory Statistics. Compute the range.
Approach The range is the difference between the largest and smallest data values.
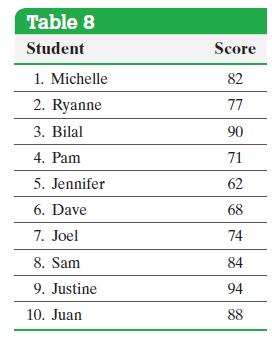
Table 8 Student Score 1. Michelle 82 2. Ryanne 77 3. Bilal 90 4. Pam 71 5. Jennifer 62 6. Dave 68 7. Joel 74 8. Sam 84 9. Justine 94 10. Juan 88
Step by Step Solution
★★★★★
3.36 Rating (159 Votes )
There are 3 Steps involved in it
1 Expert Approved Answer
Step: 1 Unlock

The highest test score is 94 and the lowes... View full answer
Question Has Been Solved by an Expert!
Get step-by-step solutions from verified subject matter experts
Step: 2 Unlock
Step: 3 Unlock