New Semester
Started
Get
50% OFF
Study Help!
--h --m --s
Claim Now
Question Answers
Textbooks
Find textbooks, questions and answers
Oops, something went wrong!
Change your search query and then try again
S
Books
FREE
Study Help
Expert Questions
Accounting
General Management
Mathematics
Finance
Organizational Behaviour
Law
Physics
Operating System
Management Leadership
Sociology
Programming
Marketing
Database
Computer Network
Economics
Textbooks Solutions
Accounting
Managerial Accounting
Management Leadership
Cost Accounting
Statistics
Business Law
Corporate Finance
Finance
Economics
Auditing
Tutors
Online Tutors
Find a Tutor
Hire a Tutor
Become a Tutor
AI Tutor
AI Study Planner
NEW
Sell Books
Search
Search
Sign In
Register
study help
statistics
openintro statistics
OpenIntro Statistics 4th Edition David Diez, Mine Çetinkaya-Rundel, Christopher Barr - Solutions
A patient named Diana was diagnosed with Fibromyalgia, a long-term syndrome of body pain, and was prescribed anti-depressants. Being the skeptic that she is, Diana didn't initially believe that anti-depressants would help her symptoms. However after a couple months of being on the medication she
In each part below, there is a value of interest and two scenarios (I and II). For each part, report if the value of interest is larger under scenario I, scenario II, or whether the value is equal under the scenarios.(a) The standard error of p̂ when (I) n = 125 or (II) n = 500.(b) The margin of
The General Social Survey asked the question: "After an average work day, about how many hours do you have to relax or pursue activities that you enjoy?" to a random sample of 1,155 Americans. A 95% confidence interval for the mean number of hours spent relaxing or pursuing activities they enjoy
In Exercise 5.21, we learned that a Rasmussen Reports survey of 1,000 US adults found that 42% believe raising the minimum wage will help the economy. Construct a 99% confidence interval for the true proportion of US adults who believe this.Data from Exercise 5.21Do a majority of US adults believe
A food safety inspector is called upon to investigate a restaurant with a few customer reports of poor sanitation practices. The food safety inspector uses a hypothesis testing framework to evaluate whether regulations are not being met. If he decides the restaurant is in gross violation, its
Determine if the following statements are true or false, and explain your reasoning. If false, state how it could be corrected.(a) If a given value (for example, the null hypothesized value of a parameter) is within a 95% confidence interval, it will also be within a 99% confidence interval.(b)
A USA Today/Gallup poll asked a group of unemployed and underemployed Americans if they have had major problems in their relationships with their spouse or another close family member as a result of not having a job (if unemployed) or not having a full-time job (if underemployed). 27% of the 1,145
It is believed that nearsightedness affects about 8% of all children. In a random sample of 194 children, 21 are nearsighted. Conduct a hypothesis test for the following question: do these data provide evidence that the 8% value is inaccurate?
The nutrition label on a bag of potato chips says that a one ounce (28 gram) serving of potato chips has 130 calories and contains ten grams of fat, with three grams of saturated fat. A random sample of 35 bags yielded a confidence interval for the number of calories per bag of 128.2 to 139.8
Define the term "sampling distribution" of the sample proportion, and describe how the shape, center, and spread of the sampling distribution change as the sample size increases when p = 0.1.
Determine whether the following statement is true or false, and explain your reasoning: "With large sample sizes, even small differences between the null value and the observed point estimate can be statistically significant."
Suppose you conduct a hypothesis test based on a sample where the sample size is n = 50, and arrive at a p-value of 0.08. You then refer back to your notes and discover that you made a careless mistake, the sample size should have been n = 500. Will your p-value increase, decrease, or stay the
A study examined the average pay for men and women entering the workforce as doctors for 21 different positions.(a) If each gender was equally paid, then we would expect about half of those positions to have men paid more than women and women would be paid more than men in the other half of
Suppose that 8% of college students are vegetarians. Determine if the following statements are true or false, and explain your reasoning.(a) The distribution of the sample proportions of vegetarians in random samples of size 60 is approximately normal since n ≥ 30.(b) The distribution of the
About 77% of young adults think they can achieve the American dream. Determine if the following statements are true or false, and explain your reasoning.(a) The distribution of sample proportions of young Americans who think they can achieve the American dream in samples of size 20 is left
Suppose that 90% of orange tabby cats are male. Determine if the following statements are true or false, and explain your reasoning. (a) The distribution of sample proportions of random samples of size 30 is left skewed. (b) Using a sample size that is 4 times as large will reduce the
About 25% of young Americans have delayed starting a family due to the continued economic slump. Determine if the following statements are true or false, and explain your reasoning. (a) The distribution of sample proportions of young Americans who have delayed starting a family due to the
The Stanford University Heart Transplant Study was conducted to determine whether an experimental heart transplant program increased lifespan. Each patient entering the program was officially designated a heart transplant candidate, meaning that he was gravely ill and might benefit from a new
The Marist Poll published a report stating that 66% of adults nationally think licensed drivers should be required to retake their road test once they reach 65 years of age. It was also reported that interviews were conducted on 1,018 American adults, and that the margin of error was 3% using a 95%
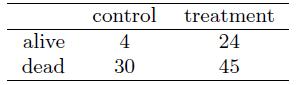
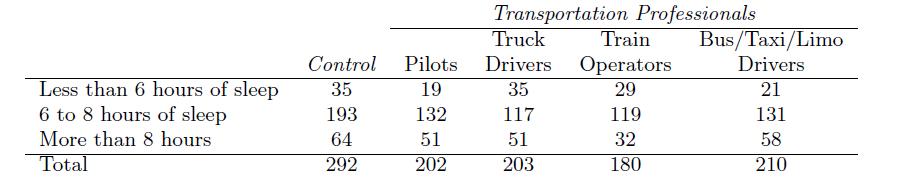
The National Sleep Foundation conducted a survey on the sleep habits of randomly sampled transportation workers and a control sample of non-transportation workers. The results of the survey are shown below.Conduct a hypothesis test to evaluate if these data provide evidence of a difference between
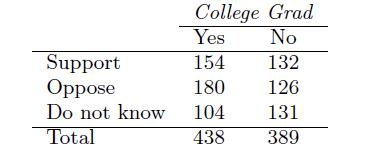
Results of a poll evaluating support for drilling for oil and natural gas off the coast of California were introduced in Exercise 6.23.(a) What percent of college graduates and what percent of the non-college graduates in this sample support drilling for oil and natural gas off the Coast of
A local news outlet reported that 56% of 600 randomly sampled Kansas residents planned to set off fireworks on July 4th. Determine the margin of error for the 56% point estimate using a 95% confidence level.
Greece has faced a severe economic crisis since the end of 2009. A Gallup poll surveyed 1,000 randomly sampled Greeks in 2011 and found that 25% of them said they would rate their lives poorly enough to be considered "suffering". (a) Describe the population parameter of interest. What is the
A survey on 1,509 high school seniors who took the SAT and who completed an optional web survey shows that 55% of high school seniors are fairly certain that they will participate in a study abroad program in college. (a) Is this sample a representative sample from the population of all high
The General Social Survey asked 1,578 US residents: "Do you think the use of marijuana should be made legal, or not?" 61% of the respondents said it should be made 13 legal. (a) Is 61% a sample statistic or a population parameter? Explain. (b) Construct a 95% confidence interval for the
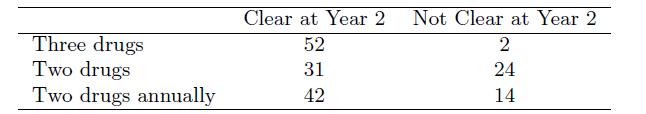
Lymphatic lariasis is a disease caused by a parasitic worm. Complications of the disease can lead to extreme swelling and other complications. Here we consider results from a randomized experiment that compared three dierent drug treatment options to clear people of the this parasite, which people
A Kaiser Family Foundation poll for US adults in 2019 found that 79% of Democrats, 55% of Independents, and 24% of Republicans supported a generic "National Health Plan". There were 347 Democrats, 298 Republicans, and 617 Independents surveyed. (a) A political pundit on TV claims that a
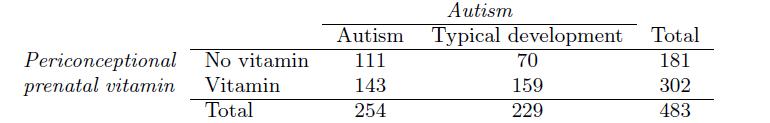
Researchers studying the link between prenatal vitamin use and autism surveyed the mothers of a random sample of children aged 24 - 60 months with autism and conducted another separate random sample for children with typical development. The table below shows the number of mothers in each group who
Among a simple random sample of 331 American adults who do not have a four-year college degree and are not currently enrolled in school, 48% said they decided not to go to college because they could not afford school.(a) A newspaper article states that only a minority of the Americans who decide
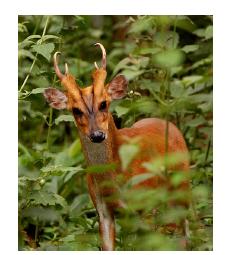
Microhabitat factors associated with forage and bed sites of barking deer in Hainan Island, China were examined. In this region woods make up 4.8% of the land, cultivated grass plot makes up 14.7%, and deciduous forests make up 39.6%. Of the 426 sites where the deer forage, 4 were categorized as
Exercise 6.12 presents the results of a poll where 48% of 331 Americans who decide to not go to college do so because they cannot afford it. (a) Calculate a 90% confidence interval for the proportion of Americans who decide to not go to college because they cannot afford it, and interpret the
Exercise 6.11 presents the results of a poll evaluating support for a generic "National Health Plan" in the US in 2019, reporting that 55% of Independents are supportive. If we wanted to estimate this number to within 1% with 90% confidence, what would be an appropriate sample size?Data from
As discussed in Exercise 6.10, the General Social Survey reported a sample where about 61% of US residents thought marijuana should be made legal. If we wanted to limit the margin of error of a 95% confidence interval to 2%, about how many Americans would we need to survey?Data from Exercise
A study asked 1,924 male and 3,666 female undergraduate college students their favorite color. A 95% confidence interval for the difference between the proportions of males and females whose favorite color is black (pmale - Pfemale) was calculated to be (0.02, 0.06). Based on this information,
The United States federal government shutdown of 2018-2019 occurred from December 22, 2018 until January 25, 2019, a span of 35 days. A Survey USA poll of 614 randomly sampled Americans during this time period reported that 48% of those who make less than $40,000 per year and 55% of those who make
Exercise 6.11 presents the results of a poll evaluating support for a generically branded "National Health Plan" in the United States. 79% of 347 Democrats and 55% of 617 Independents support a National Health Plan. (a) Calculate a 95% confidence interval for the difference between the
A survey asked 827 randomly sampled registered voters in California "Do you support? Or do you oppose? Drilling for oil and natural gas off the Coast of California? Or do you not know enough to say?" Below is the distribution of responses, separated based on whether or not the respondent graduated
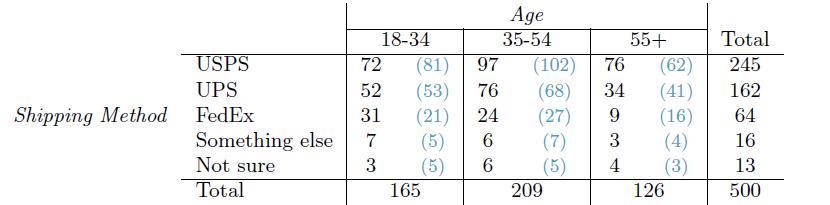
A local news survey asked 500 randomly sampled Los Angeles residents which shipping carrier they prefer to use for shipping holiday gifts. The table below shows the distribution of responses by age group as well as the expected counts for each cell (shown in parentheses).(a) State the null and
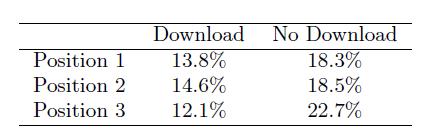
The OpenIntro website occasionally experiments with design and link placement. We conducted one experiment testing three different placements of a download link for this textbook on the book's main page to see which location, if any, led to the most downloads. The number of site visitors included
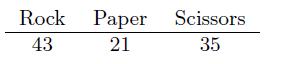
Rock-paper-scissors is a hand game played by two or more people where players choose to sign either rock, paper, or scissors with their hands. For your statistics class project, you want to evaluate whether players choose between these three options randomly, or if certain options are favored above
In July 2008 the US National Institutes of Health announced that it was stopping a clinical study early because of unexpected results. The study population consisted of HIV-infected women in sub-Saharan Africa who had been given single dose Nevaripine (a treatment for HIV) while giving birth, to
A physical education teacher at a high school wanting to increase awareness on issues of nutrition and health asked her students at the beginning of the semester whether they believed the expression "an apple a day keeps the doctor away", and 40% of the students responded yes. Throughout the
Determine if the statements below are true or false. For each false statement, suggest an alternative wording to make it a true statement. (a) The chi-square distribution, just like the normal distribution, has two parameters, mean and standard deviation. (b) The chi-square distribution
Determine if the statements below are true or false. For each false statement, suggest an alternative wording to make it a true statement. (a) As the degrees of freedom increases, the mean of the chisquare distribution increases. (b) If you found X2 = 10 with df = 5 you would fail to
Does being part of a support group affect the ability of people to quit smoking? A county health department enrolled 300 smokers in a randomized experiment. 150 participants were assigned to a group that used a nicotine patch and met weekly with a support group; the other 150 received the patch and
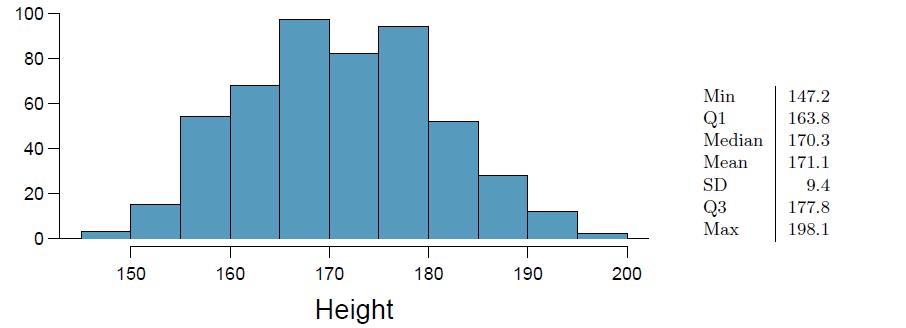
Researchers studying anthropometry collected body girth measurements and skele- tal diameter measurements, as well as age, weight, height and gender, for 507 physically active individuals. The histogram below shows the sample distribution of heights in centimeters.(a) What is the point estimate for
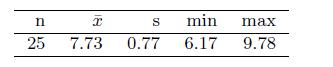
New York is known as "the city that never sleeps". A random sample of 25 New Yorkers were asked how much sleep they get per night. Statistical summaries of these data are shown below. The point estimate suggests New Yorkers sleep less than 8 hours a night on average. Is the result statistically
A teacher wanting to increase the active learning component of her course is concerned about student reactions to changes she is planning to make. She conducts a survey in her class, asking students whether they believe more active learning in the classroom (hands on exercises) instead of
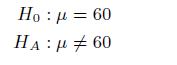
You are given the following hypotheses:We know that the sample standard deviation is 8 and the sample size is 20. For what sample mean would the p-value be equal to 0.05? Assume that all conditions necessary for inference are satisfied. Ho : μ = 60 Ha : μ # 60
We are interested in estimating the proportion of students at a university who smoke. Out of a random sample of 200 students from this university, 40 students smoke.(a) Calculate a 95% confidence interval for the proportion of students at this university who smoke, and interpret this interval in
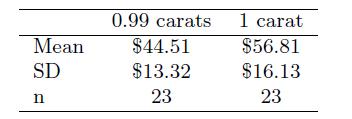
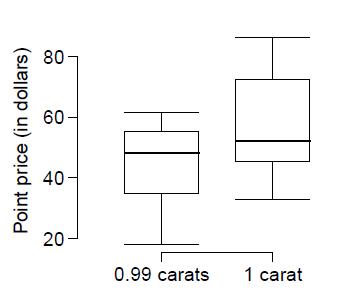
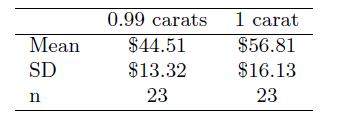
In Exercise 7.24, we discussed diamond prices (standardized by weight) for diamonds with weights 0. 99 carats and 1 carat. See the table for summary statistics, and then construct a 95% confidence interval for the average difference between the standardized prices of 0.99 and 1 carat diamonds. You
It believed that large doses of acetaminophen (the active ingredient in over the counter pain relievers like Tylenol) may cause damage to the liver. A researcher wants to conduct a study to estimate the proportion of acetaminophen users who have liver damage. For participating in this study, he
A Gallup poll surveyed Americans about their employment status and whether or not they have diabetes. The survey results indicate that 1.5% of the 47,774 employed (full or part time) and 2.5% of the 5,855 unemployed 18-29 year olds have diabetes.(a) Create a two-way table presenting the results of
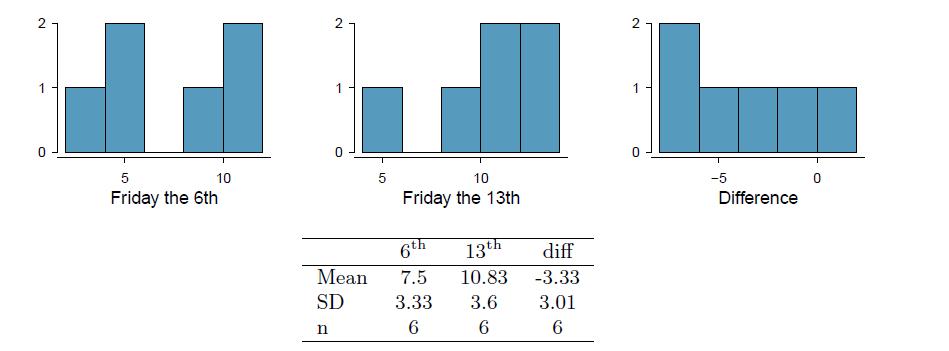
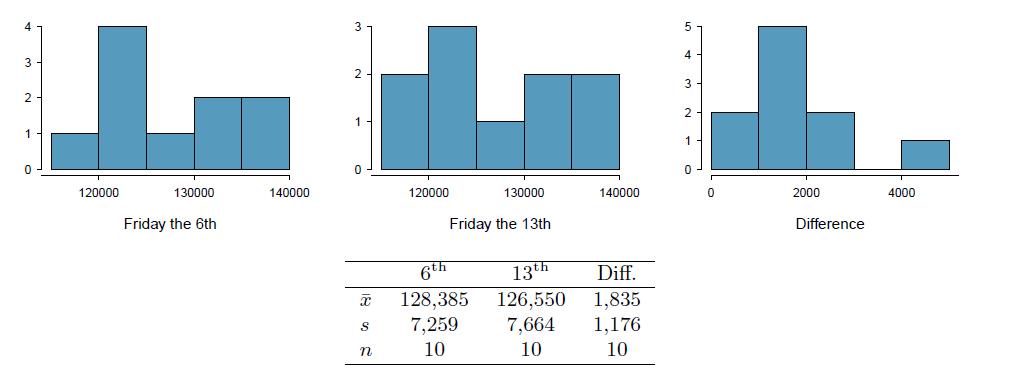
The Friday the 13th study reported in Exercise 7.23 also provides data on traffic accident related emergency room admissions. The distributions of these counts from Friday the 6th and Friday the 13th are shown below for six such paired dates along with summary statistics. You may assume that
Prices of diamonds are determined by what is known as the 4 Cs: cut, clarity, color, and carat weight. The prices of diamonds go up as the carat weight increases, but the increase is not smooth. For example, the difference between the size of a 0.99 carat diamond and a 1 carat diamond is
On June 28, 2012 the U.S. Supreme Court upheld the much debated 2010 healthcare law, declaring it constitutional. A Gallup poll released the day after this decision indicates that 46% of 1,012 Americans agree with this decision. At a 95% confidence level, this sample has a 3% margin of error. Based
An independent random sample is selected from an approximately normal population with unknown standard deviation. Find the degrees of freedom and the critical t-value (t*) for the given sample size and confidence level. (a) n = 6, CL = 90% (b) n = 21, CL = 98% (c) n = 29, CL =
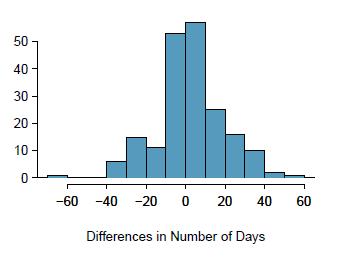
Let's consider a limited set of climate data, examining temperature differences in 1948 vs 2018. We sampled 197 locations from the National Oceanic and Atmospheric Administration's (NOAA) historical data, where the data was available for both years of interest. We want to know: were there more days
An independent random sample is selected from an approximately normal population with an unknown standard deviation. Find the p-value for the given sample size and test statistic. Also determine if the null hypothesis would be rejected at α = 0.05. (a) n = 11, T = 1.91 (b) n = 17, T =
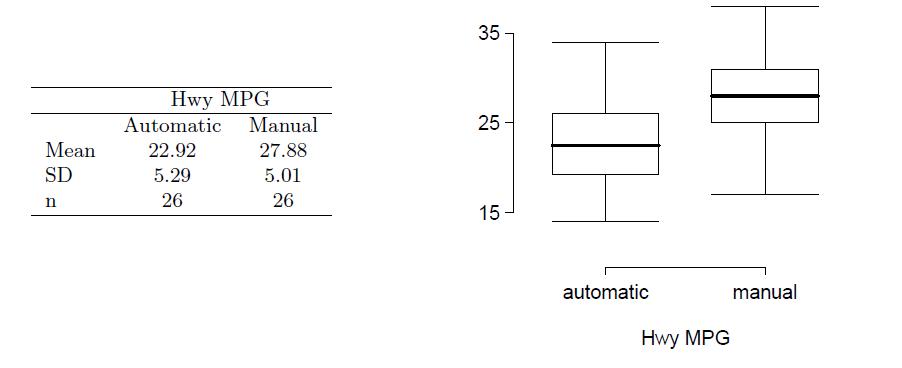
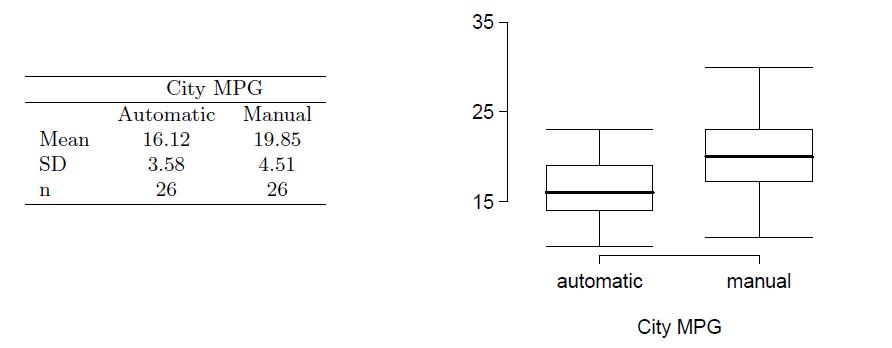
The table provides summary statistics on highway fuel economy of the same 52 cars from Exercise 7.28. Use these statistics to calculate a 98% confidence interval for the difference between average highway mileage of manual and automatic cars, and interpret this interval in the context of the
An independent random sample is selected from an approximately normal population with an unknown standard deviation. Find the p-value for the given sample size and test statistic. Also determine if the null hypothesis would be rejected at a = 0.01. (a) n = 26, T = 2.485 (b) n = = 18, T =
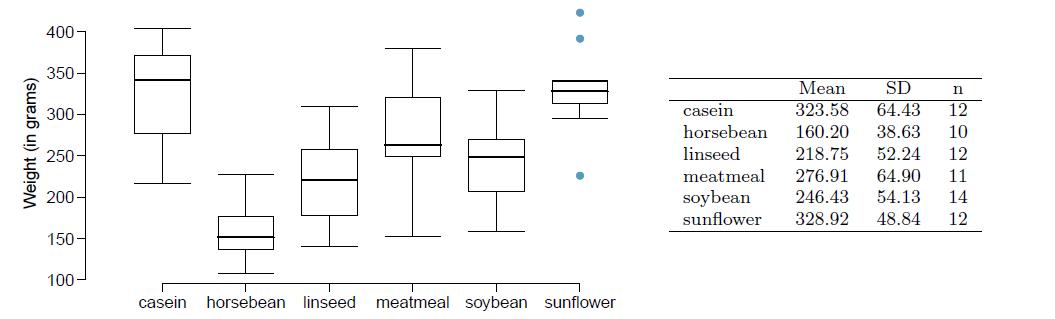
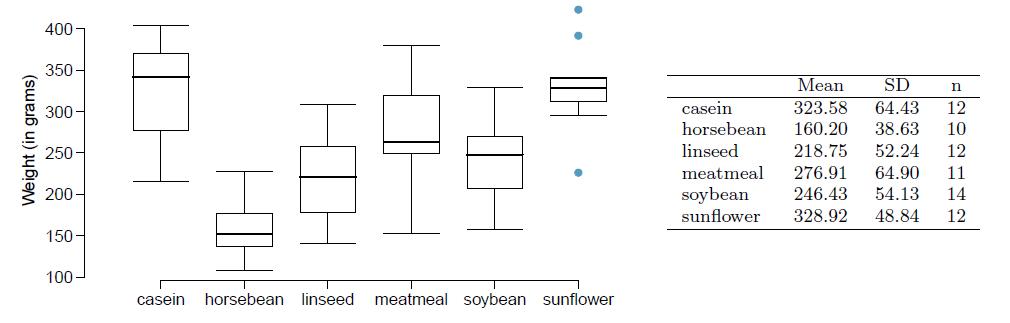
Chicken farming is a multi-billion dollar industry, and any methods that increase the growth rate of young chicks can reduce consumer costs while increasing company profits, possibly by millions of dollars. An experiment was conducted to measure and compare the effectiveness of various feed
In the early 1990's, researchers in the UK collected data on traffic flow, number of shoppers, and traffic accident related emergency room admissions on Friday the 13th and the previous Friday, Friday the 6th. The histograms below show the distribution of number of cars passing by a specific
We considered the change in the number of days exceeding 90°F from 1948 and 2018 at 197 randomly sampled locations from the NOAA database in Exercise 7.19. The mean and standard deviation of the reported differences are 2.9 days and 17.2 days. Data from in Exercise 7.19Let's consider a limited
A 95% confidence interval for a population mean, , is given as (18.985, 21.015). This confidence interval is based on a simple random sample of 36 observations. Calculate the sample mean and standard deviation. Assume that all conditions necessary for inference are satisfied. Use the t-distribution
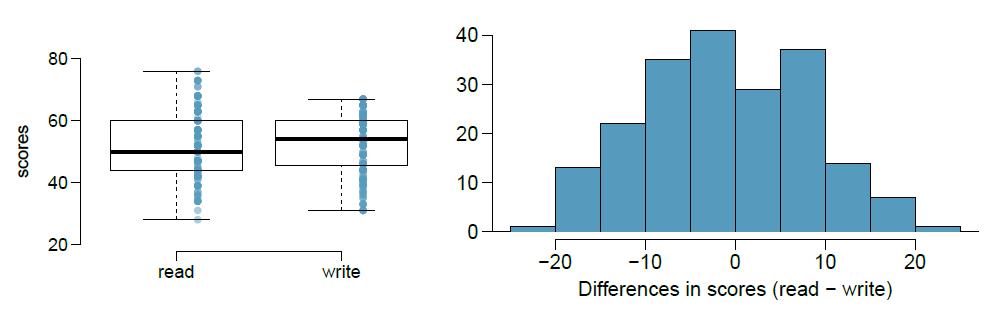
We considered the differences between the reading and writing scores of a random sample of 200 students who took the High School and Beyond Survey in Exercise 7.20. The mean and standard deviation of the differences are x̄read-write = -0.545 and 8.887 points. (a) Calculate a 95% confidence
A 90% confidence interval for a population mean is (65, 77). The population distribution is approximately normal and the population standard deviation is unknown. This confidence interval is based on a simple random sample of 25 observations. Calculate the sample mean, the margin of error, and the
The National Center of Education Statistics conducted a survey of high school seniors, collecting test data on reading, writing, and several other subjects. Here we examine a simple random sample of 200 students from this survey. Side-by-side box plots of reading and writing scores as well as a
Casein is a common weight gain supplement for humans. Does it have an effect on chickens? Using data provided in Exercise 7.27, test the hypothesis that the average weight of chickens that were fed casein is different than the average weight of chickens that were fed soybean. If your hypothesis
Each year the US Environmental Protection Agency (EPA) releases fuel economy data on cars manufactured in that year. Below are summary statistics on fuel efficiency (in miles/gallon) from random samples of cars with manual and automatic transmissions. Do these data provide strong evidence of a
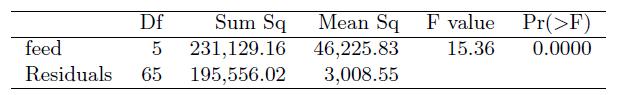
In Exercises 7.27 and 7.29 we compared the effects of two types of feed at a time. A better analysis would first consider all feed types at once: casein, horsebean, linseed, meat meal, soybean, and sunflower. The ANOVA output below can be used to test for differences between the average weights of
For a given confidence level, t*df is larger than z*. Explain how t*df being slightly larger than z* affects the width of the confidence interval.
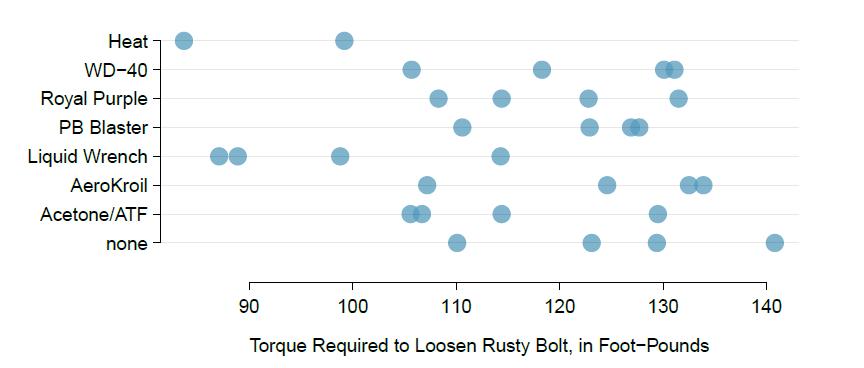
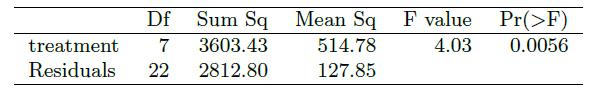
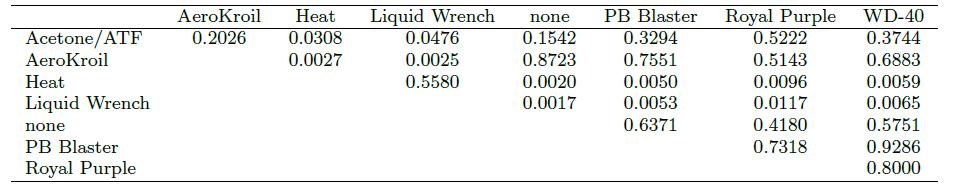
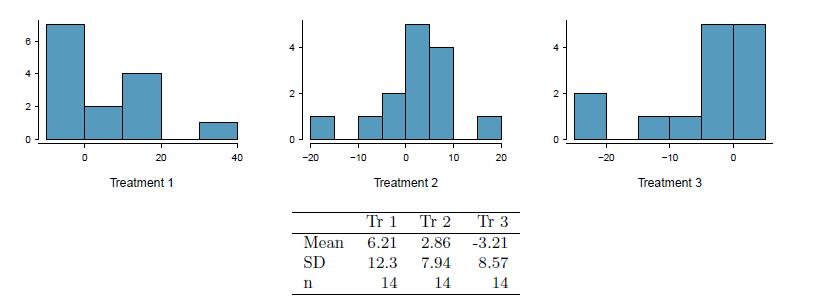
Project Farm is a YouTube channel that routinely compares different products. In one episode, the channel evaluated different options for loosening rusty bolts. Eight options were evaluated, including a control group where no treatment was given ("none" in the graph), to determine which was most
Georgianna claims that in a small city renowned for its music school, the average child takes less than 5 years of piano lessons. We have a random sample of 20 children from the city, with a mean of 4.6 years of piano lessons and a standard deviation of 2.2 years. (a) Evaluate Georgianna's
A market researcher wants to evaluate car insurance savings at a competing company. Based on past studies he is assuming that the standard deviation of savings is $100. He wants to collect data such that he can get a margin of error of no more than $10 at a 95% confidence level. How large of a
The standard deviation of SAT scores for students at a particular Ivy League college is 250 points. Two statistics students, Raina and Luke, want to estimate the average SAT score of students at this college as part of a class project. They want their margin of error to be no more than 25
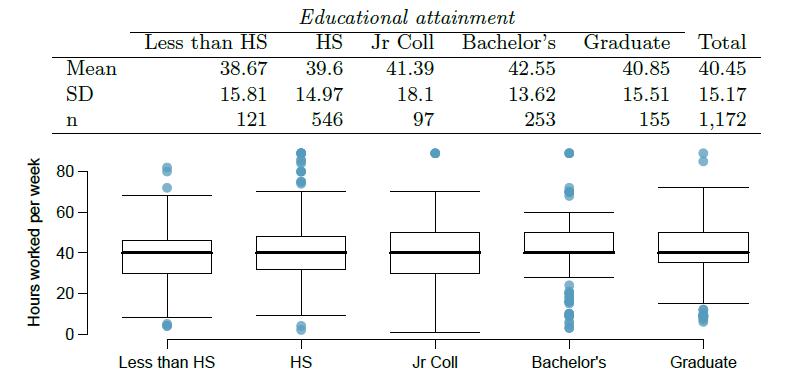
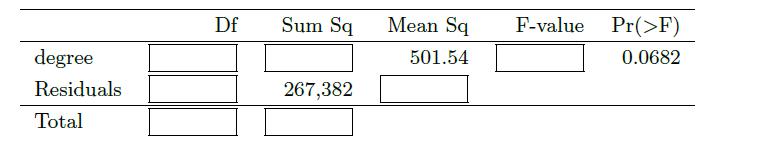
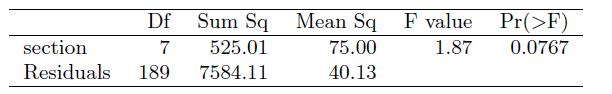
The General Social Survey collects data on demographics, education, and work, among many other characteristics of US residents. Using ANOVA, we can consider educational attainment levels for all 1,172 respondents at once. Below are the distributions of hours worked by educational attainment and
Air quality measurements were collected in a random sample of 25 country capitals in 2013, and then again in the same cities in 2014. We would like to use these data to compare average air quality between the two years. Should we use a paired or non-paired test? Explain your reasoning.
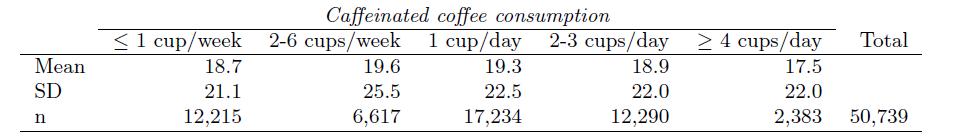
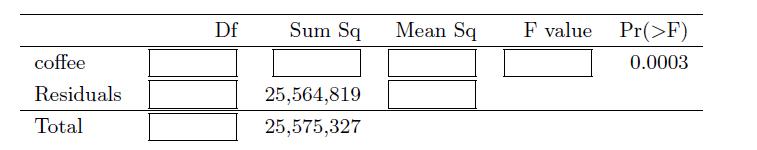
Caffeine is the world's most widely used stimulant, with approximately 80% consumed in the form of coffee. Participants in a study investigating the relationship between coffee consumption and exercise were asked to report the number of hours they spent per week on moderate (e.g., brisk walking)
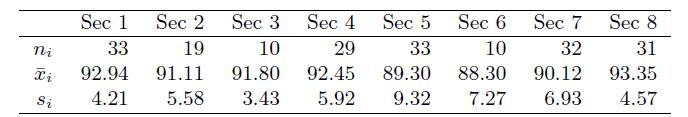
A professor who teaches a large introductory statistics class (197 students) with eight discussion sections would like to test if student performance differs by discussion section, where each discussion section has a different teaching assistant. The summary table below shows the average final exam
Determine if the following statements are true or false. If false, explain. (a) In a paired analysis we first take the difference of each pair of observations, and then we do inference on these differences. (b) Two data sets of different sizes cannot be analyzed as paired data. (c)
In each of the following scenarios, determine if the data are paired. (a) Compare pre- (beginning of semester) and post-test (end of semester) scores of students. (b) Assess gender-related salary gap by comparing salaries of randomly sampled men and women. (c) Compare artery
In each of the following scenarios, determine if the data are paired. (a) We would like to know if Intel's stock and Southwest Airlines' stock have similar rates of return. To find out, we take a random sample of 50 days, and record Intel's and Southwest's stock on those same days. (b) We
When doing an ANOVA, you observe large differences in means between groups. Within the ANOVA framework, this would most likely be interpreted as evidence strongly favoring the _____________________hypothesis.
Determine if the following statements are true or false, and explain your reasoning for statements you identify as false. (a) When comparing means of two samples where n1 = 20 and n2 = 40, we can use the normal model for the difference in means since n2 ≥ 30. (b) As the degrees of
Subjects from Central Prison in Raleigh, NC, volunteered for an experiment involving an "isolation" experience. The goal of the experiment was to find a treatment that reduces subjects' psychopathic deviant T scores. This score measures a person's need for control or their rebellion against
A large farm wants to try out a new type of fertilizer to evaluate whether it will improve the farm's corn production. The land is broken into plots that produce an average of 1,215 pounds of corn with a standard deviation of 94 pounds per plot. The owner is interested in detecting any average
A medical research group is recruiting people to complete short surveys about their medical history. For example, one survey asks for information on a person's family history in regards to cancer. Another survey asks about what topics were discussed during the person's last visit to a hospital. So
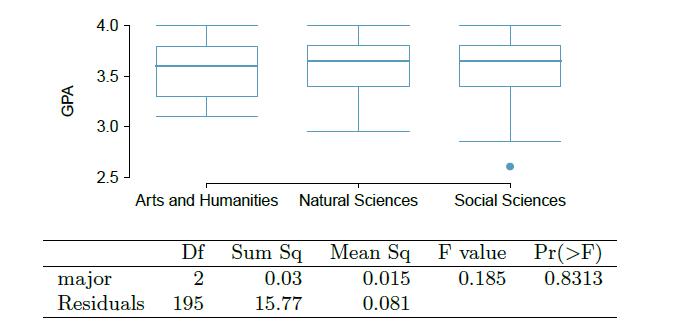
Undergraduate students taking an introductory statistics course at Duke University conducted a survey about GPA and major. The side-by-side box plots show the distribution of GPA among three groups of majors. Also provided is the ANOVA output.(a) Write the hypotheses for testing for a difference
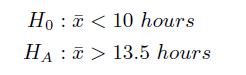
A study suggests that the average college student spends 10 hours per week communicating with others online. You believe that this is an underestimate and decide to collect your own sample for a hypothesis test. You randomly sample 60 students from your dorm and find that on average they spent 13.5
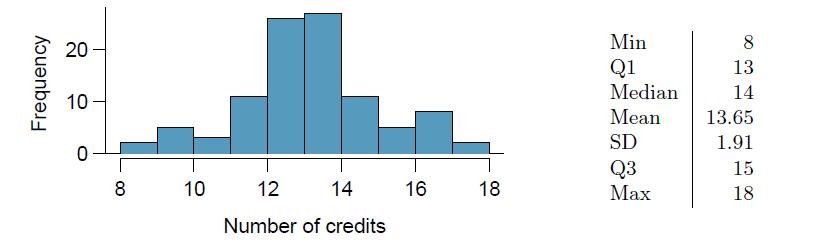
A college counselor is interested in estimating how many credits a student typically enrolls in each semester. The counselor decides to randomly sample 100 students by using the registrar's database of students. The histogram below shows the distribution of the number of credits taken by these
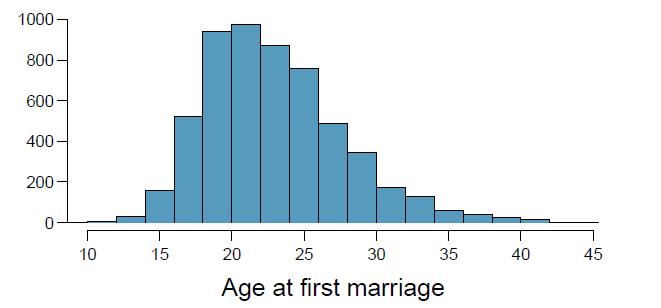
The National Survey of Family Growth conducted by the Centers for Disease Control gathers information on family life, marriage and divorce, pregnancy, infertility, use of contraception, and men's and women's health. One of the variables collected on this survey is the age at first marriage. The
We would like to test if students who are in the social sciences, natural sciences, arts and humanities, and other fields spend the same amount of time studying for this course. What type of test should we use? Explain your reasoning.
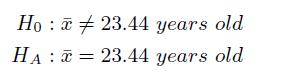
Exercise 7.56 presents the results of a 2006 - 2010 survey showing that the average age of women at first marriage is 23.44. Suppose a social scientist thinks this value has changed since the survey was taken. Below is how she set up her hypotheses. Indicate any errors you see.Data from Exercise
A study compared five different methods for teaching descriptive statistics. The five methods were traditional lecture and discussion, programmed textbook instruction, programmed text with lectures, computer instruction, and computer instruction with lectures. 45 students were randomly assigned, 9
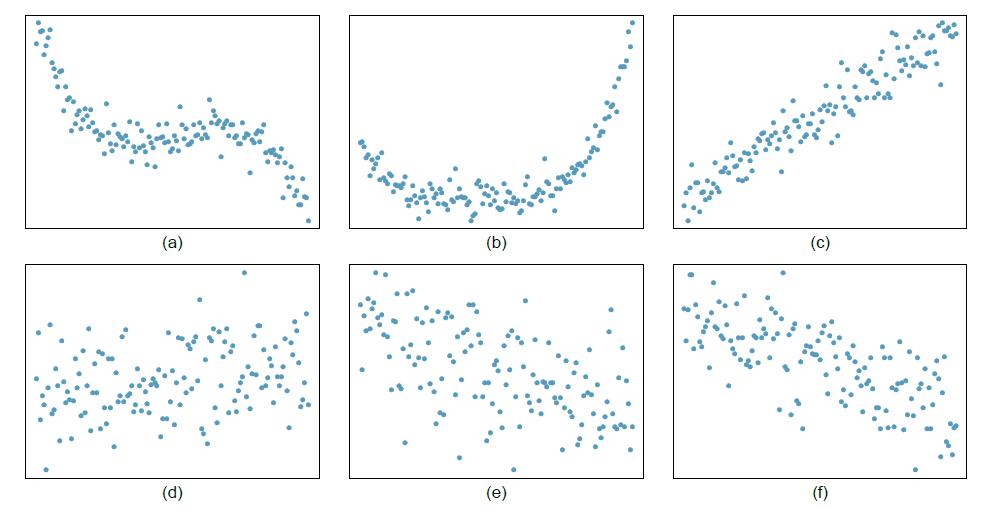
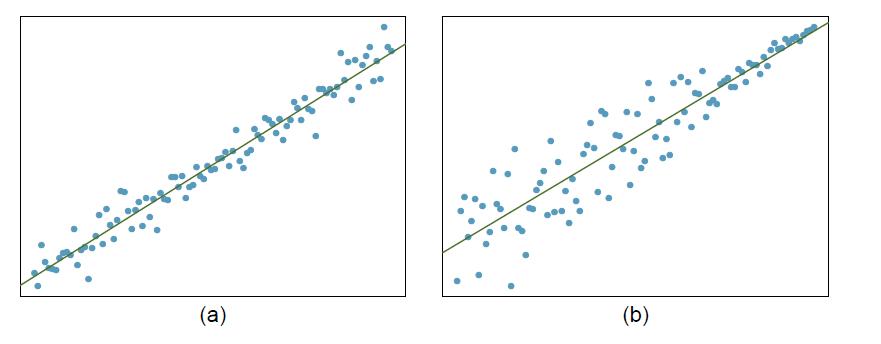
For each of the six plots, identify the strength of the relationship (e.g. weak, moderate, or strong) in the data and whether fitting a linear model would be reasonable. (a) (d) (e) (c) (f)
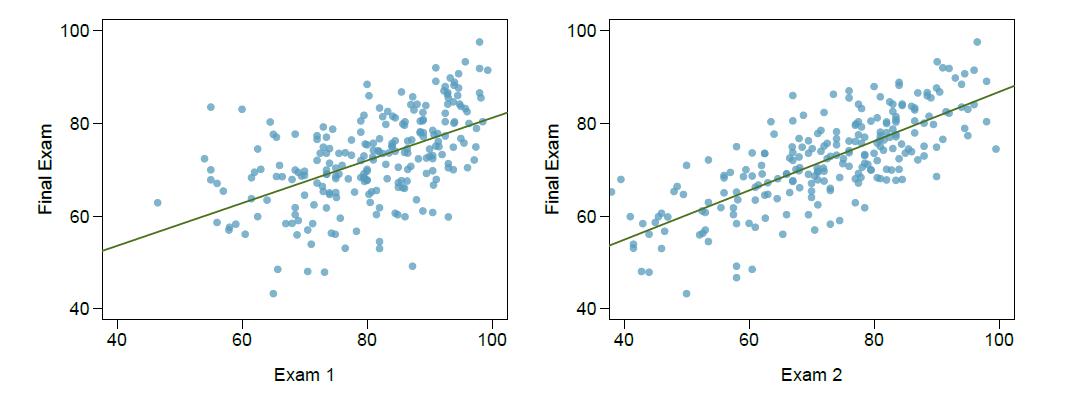
The two scatterplots below show the relationship between final and mid-semester exam grades recorded during several years for a Statistics course at a university.(a) Based on these graphs, which of the two exams has the strongest correlation with the final exam grade? Explain.(b) Can you think of a
The scatterplots shown below each have a superimposed regression line. If we were to construct a residual plot (residuals versus x) for each, describe what those plots would look like. (a) (b)
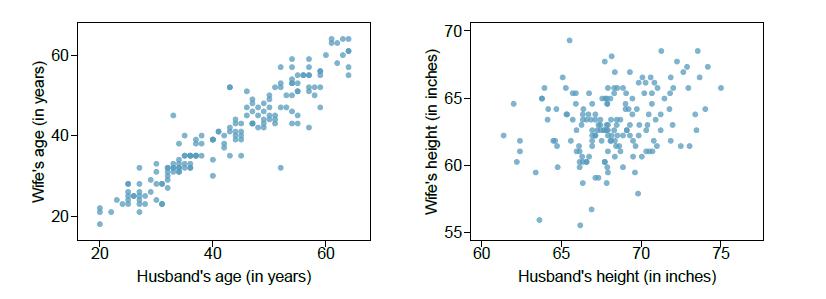
The Great Britain Office of Population Census and Surveys once collected data on a random sample of 170 married couples in Britain, recording the age (in years) and heights (converted here to inches) of the husbands and wives.5 The scatterplot on the left shows the wife's age plotted against her
Determine if the following statements are true or false in ANOVA, and explain your reasoning for statements you identify as false.(a) As the number of groups increases, the modified significance level for pairwise tests increases as well.(b) As the total sample size increases, the degrees of
Showing 1000 - 1100
of 1303
1
2
3
4
5
6
7
8
9
10
11
12
13
14
Step by Step Answers