New Semester
Started
Get
50% OFF
Study Help!
--h --m --s
Claim Now
Question Answers
Textbooks
Find textbooks, questions and answers
Oops, something went wrong!
Change your search query and then try again
S
Books
FREE
Study Help
Expert Questions
Accounting
General Management
Mathematics
Finance
Organizational Behaviour
Law
Physics
Operating System
Management Leadership
Sociology
Programming
Marketing
Database
Computer Network
Economics
Textbooks Solutions
Accounting
Managerial Accounting
Management Leadership
Cost Accounting
Statistics
Business Law
Corporate Finance
Finance
Economics
Auditing
Tutors
Online Tutors
Find a Tutor
Hire a Tutor
Become a Tutor
AI Tutor
AI Study Planner
NEW
Sell Books
Search
Search
Sign In
Register
study help
statistics
openintro statistics
OpenIntro Statistics 4th Edition David Diez, Mine Çetinkaya-Rundel, Christopher Barr - Solutions
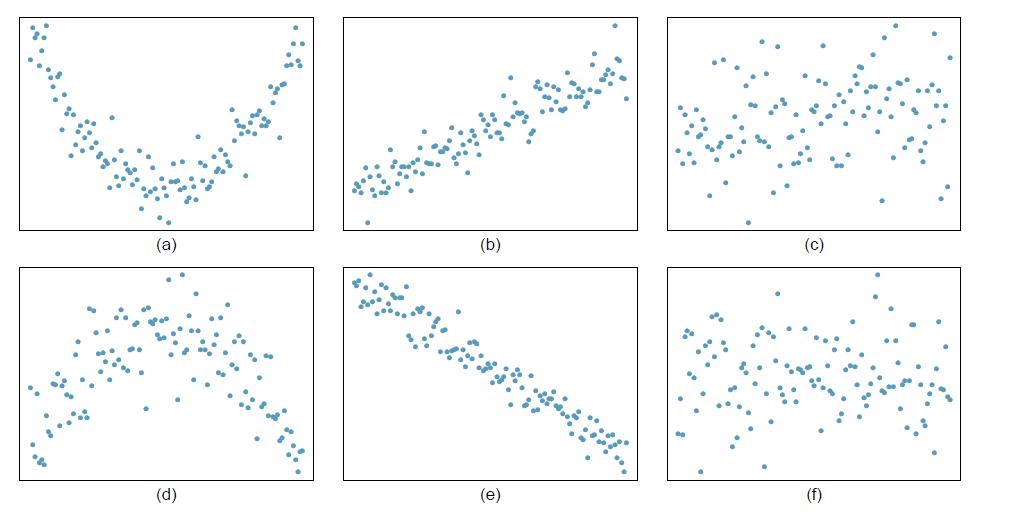
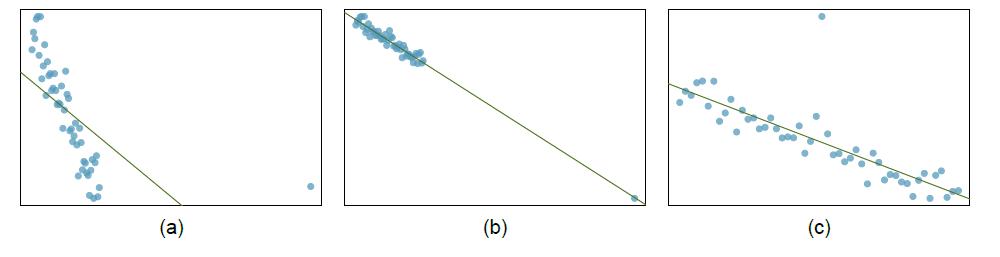
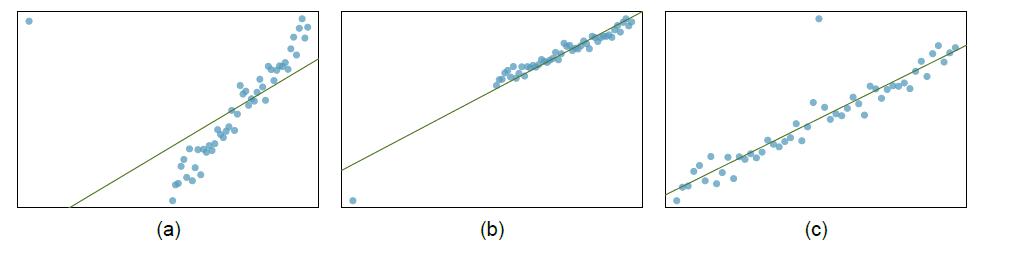
For each of the six plots, identify the strength of the relationship (e.g. weak, moderate, or strong) in the data and whether fitting a linear model would be reasonable. (d) (b) (e) (c) (f)
Determine if the following statements are true or false, and explain your reasoning for statements you identify as false. If the null hypothesis that the means of four groups are all the same is rejected using ANOVA at a 5% significance level, then ...(a) We can then conclude that all the means are
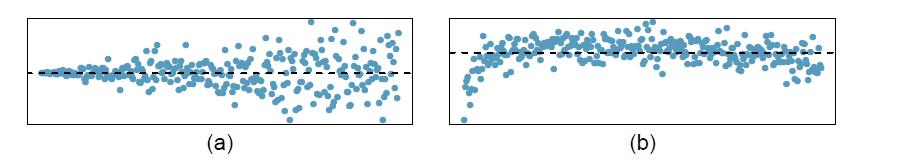
Shown below are two plots of residuals remaining after fitting a linear model to two different sets of data. Describe important features and determine if a linear model would be appropriate for these data. Explain your reasoning. (a) (b)
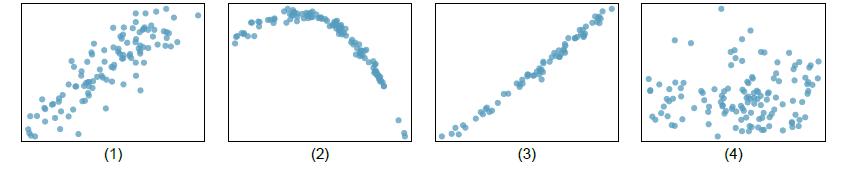
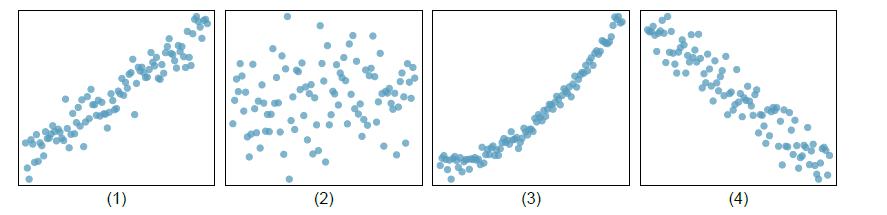
Match each correlation to the corresponding scatterplot.(a) R = -0:7(b) R = 0:45(c) R = 0:06(d) R = 0:92 (1) (2) (3) (4)
A group of researchers are interested in the possible effects of distracting stimuli during eating, such as an increase or decrease in the amount of food consumption. To test this hypothesis, they monitored food intake for a group of 44 patients who were randomized into two equal groups. The
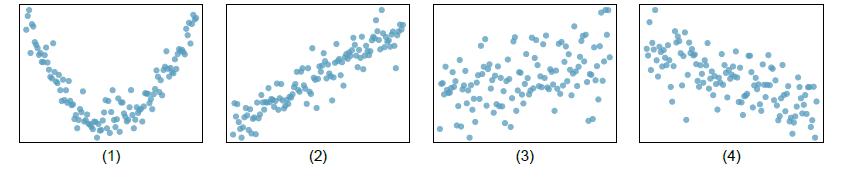
Match each correlation to the corresponding scatterplot.(a) R = 0:49(b) R = -0:48(c) R = -0:03(d) R = -0:85 (1) (2) (3) (4)
The researchers from Exercise 7.47 also investigated the effects of being distracted by a game on how much people eat. The 22 patients in the treatment group who ate their lunch while playing solitaire were asked to do a serial-order recall of the food lunch items they ate. The average number of
Determine if the following statement is true or false, and if false, explain your reasoning: If comparing means of two groups with equal sample sizes, always use a paired test.
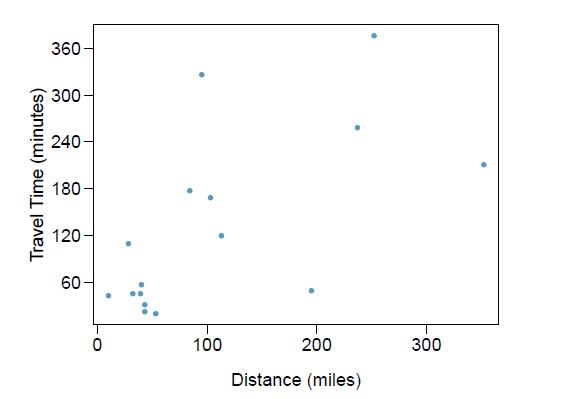
The Coast Starlight Amtrak train runs from Seattle to Los Angeles. The scatterplot below displays the distance between each stop (in miles) and the amount of time it takes to travel from one stop to another (in minutes).(a) Describe the relationship between distance and travel time.(b) How would
1,302 UCLA students were asked to fill out a survey where they were asked about their height, fastest speed they have ever driven, and gender. The scatterplot on the left displays the relationship between height and fastest speed, and the scatterplot on the right displays the breakdown by gender in
The distribution of the number of eggs laid by a certain species of hen during their breeding period has a mean of 35 eggs with a standard deviation of 18.2. Suppose a group of researchers randomly samples 45 hens of this species, counts the number of eggs laid during their breeding period, and
At a startup company running a new weather app, an engineering team generally runs experiments where a random sample of 1% of the app's visitors in the control group and another 1% were in the treatment group to test each new feature. The team's core goal is to increase a metric called daily
A study conducted at the University of Denver investigated whether babies take longer to learn to crawl in cold months, when they are often bundled in clothes that restrict their movement, than in warmer months. Infants born during the study year were split into twelve groups, one for each birth
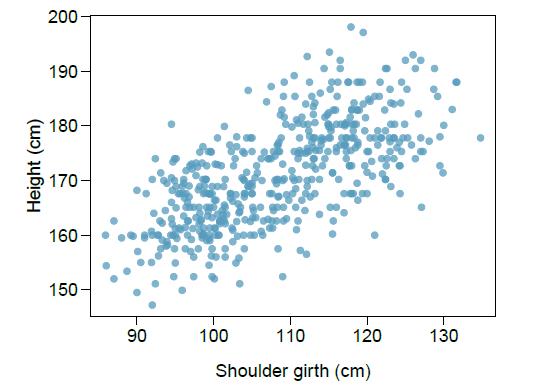
Researchers studying anthropometry collected body girth measurements and skeletal diameter measurements, as well as age, weight, height and gender for 507 physically active individuals. The scatterplot below shows the relationship between height and shoulder girth (over deltoid muscles), both
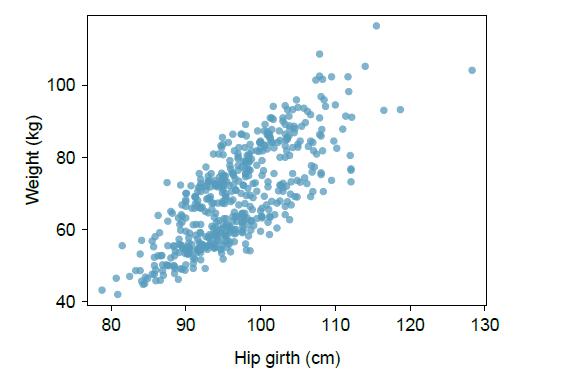
The scatterplot below shows the relationship between weight measured in kilograms and hip girth measured in centimeters from the data described in Exercise 8.13.(a) Describe the relationship between hip girth and weight.(b) How would the relationship change if weight was measured in pounds while
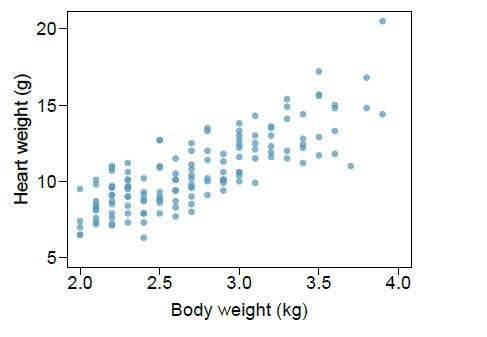
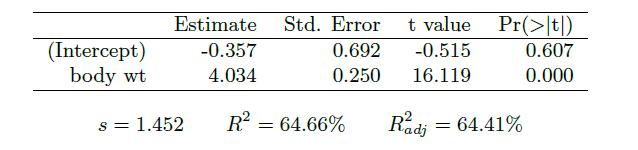
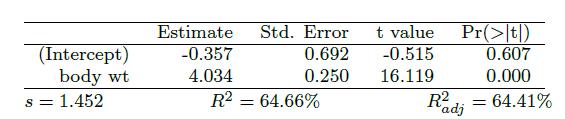
The following regression output is for predicting the heart weight (in g) of cats from their body weight (in kg). The coefficients are estimated using a dataset of 144 domestic cats.(a) Write out the linear model.(b) Interpret the intercept.(c) Interpret the slope.(d) Interpret R2.(e) Calculate the
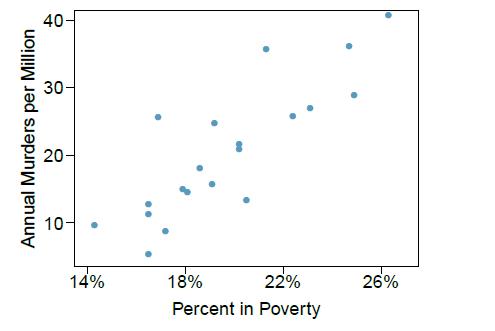
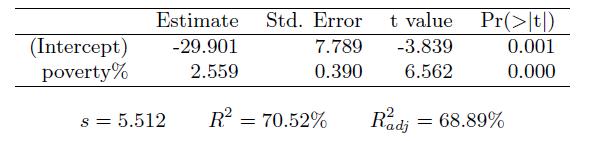
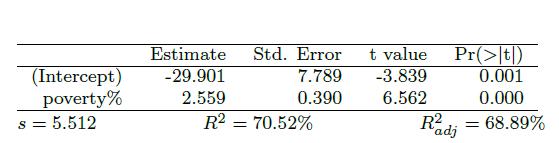
The following regression output is for predicting annual murders per million from percentage living in poverty in a random sample of 20 metropolitan areas.(a) Write out the linear model.(b) Interpret the intercept.(c) Interpret the slope.(d) Interpret R2.(e) Calculate the correlation coefficient.
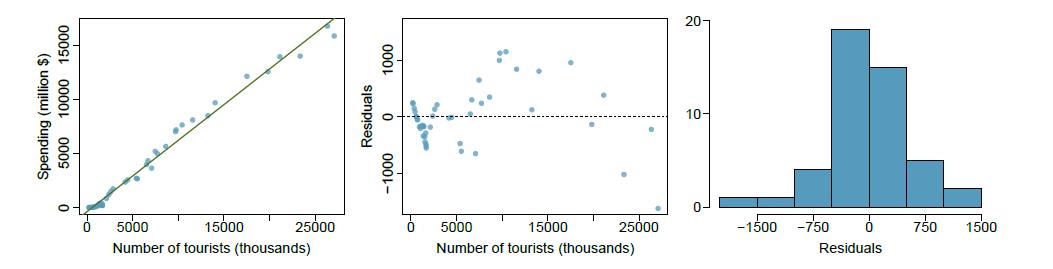
The Association of Turkish Travel Agencies reports the number of foreign tourists visiting Turkey and tourist spending by year. Three plots are provided: scatterplot showing the relationship between these two variables along with the least squares t, residuals plot, and histogram of residuals.(a)
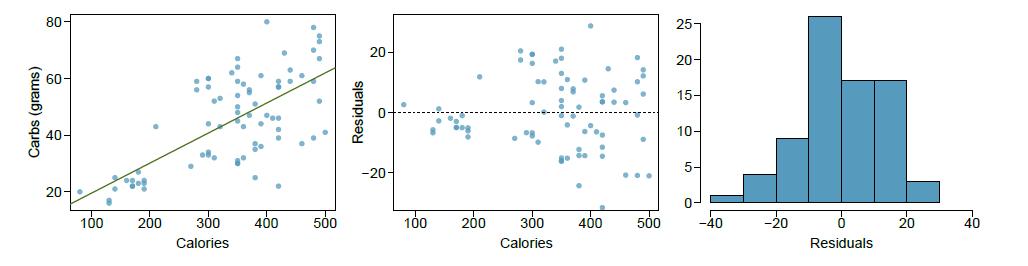
The scatterplot below shows the relationship between the number of calories and amount of carbohydrates (in grams) Starbucks food menu items contain. Since Starbucks only lists the number of calories on the display items, we are interested in predicting the amount of carbs a menu item has based on
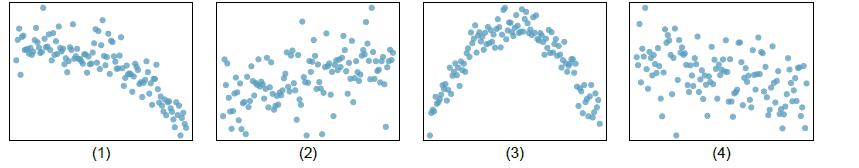
Identify the outliers in the scatterplots shown below, and determine what type of outliers they are. Explain your reasoning. (a) (b) வெளியத்தியைக் குன்றங்கள்.
Eduardo and Rosie are both collecting data on number of rainy days in a year and the total rainfall for the year. Eduardo records rainfall in inches and Rosie in centimeters. How will their correlation coefficients compare?
Identify the outliers in the scatterplots shown below and determine what type of outliers they are. Explain your reasoning. (a) (b) ਸ (c)
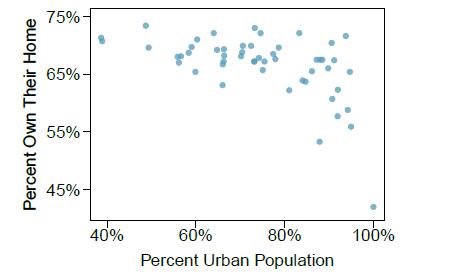
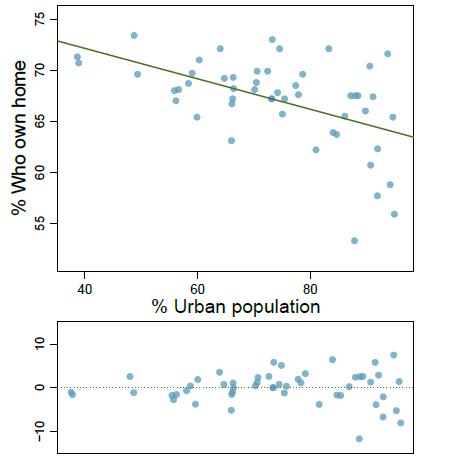
The scatterplot below shows the percent of families who own their home vs. the percent of the population living in urban areas. There are 52 observations, each corresponding to a state in the US. Puerto Rico and District of Columbia are also included.(a) Describe the relationship between the
Exercise 8.25 presents regression output from a model for predicting annual murders per million from percentage living in poverty based on a random sample of 20 metropolitan areas. The model output is also provided below.(a) What are the hypotheses for evaluating whether poverty percentage is a
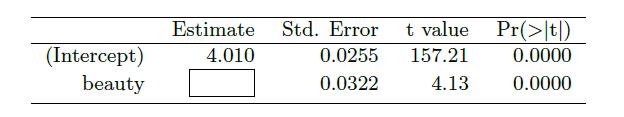
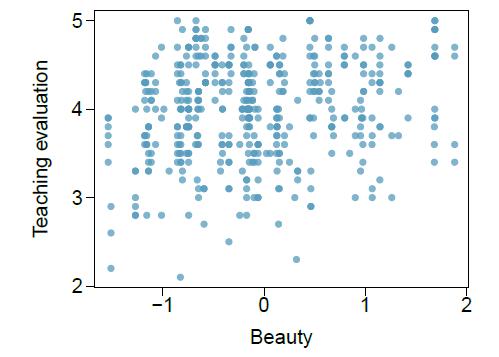
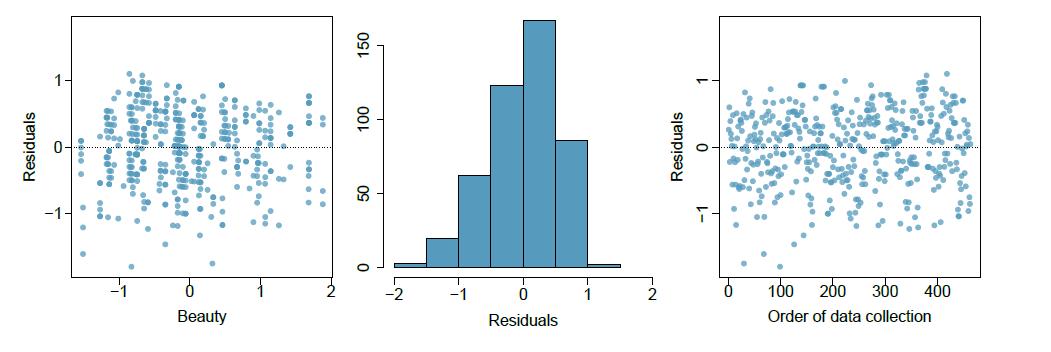
Many college courses conclude by giving students the opportunity to evaluate the course and the instructor anonymously. However, the use of these student evaluations as an indicator of course quality and teaching effectiveness is often criticized because these measures may reflect the influence of
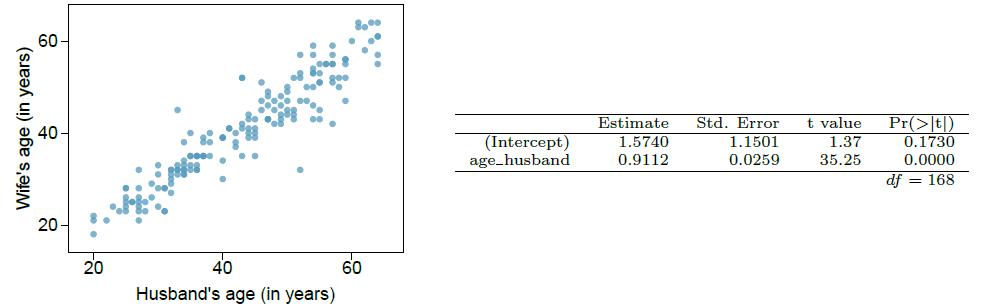
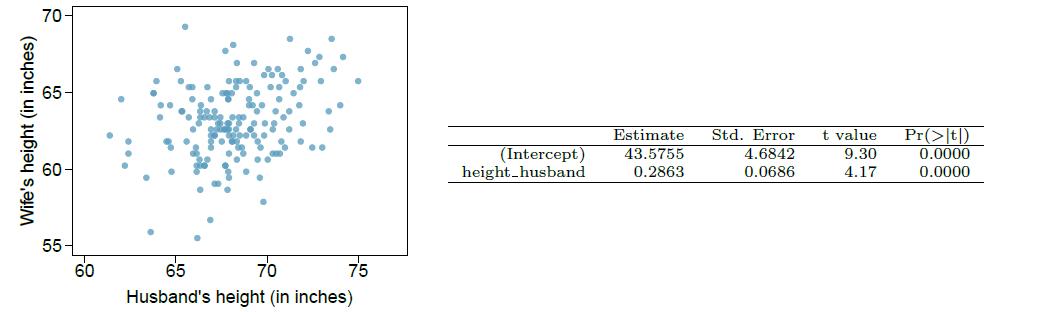
Exercise 8.33 presents a scatterplot displaying the relationship between husbands' and wives' ages in a random sample of 170 married couples in Britain, where both partners' ages are below 65 years. Given below is summary output of the least squares fit for predicting wife's age from husband's
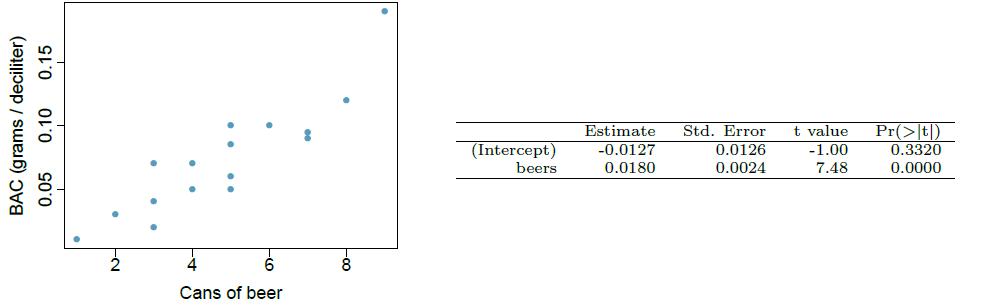
Many people believe that gender, weight, drinking habits, and many other factors are much more important in predicting blood alcohol content (BAC) than simply considering the number of drinks a person consumed. Here we examine data from sixteen student volunteers at Ohio State University who each
What would be the correlation between the ages of husbands and wives if men always married woman who were(a) 3 years younger than themselves?(b) 2 years older than themselves?(c) half as old as themselves?
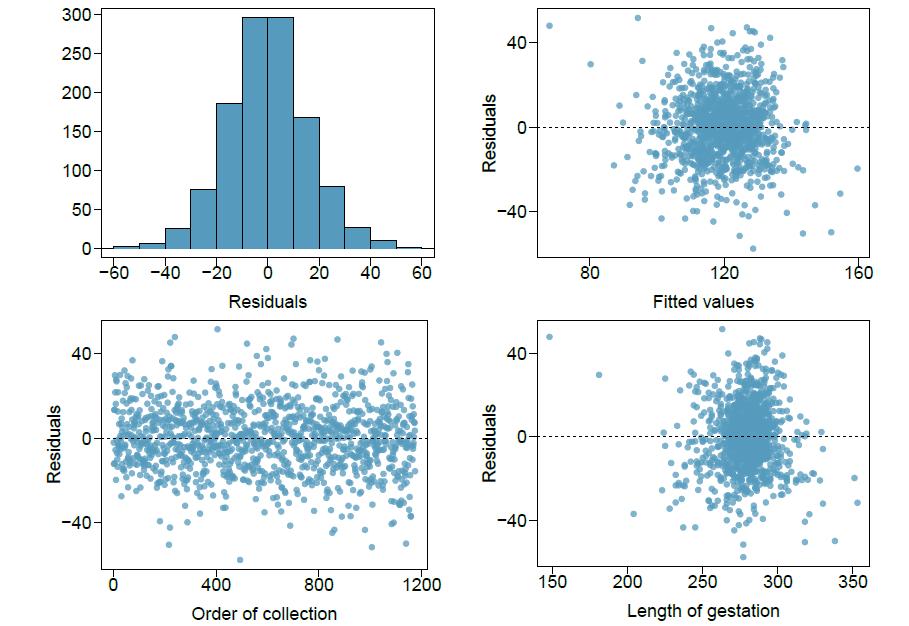
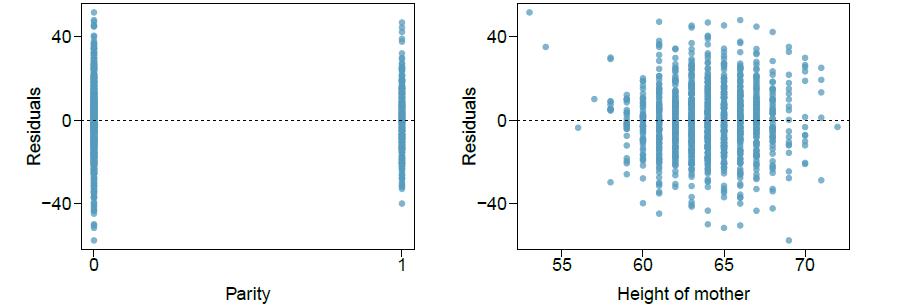
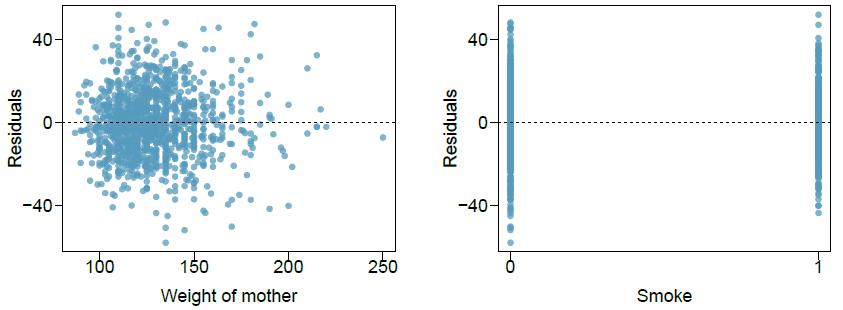
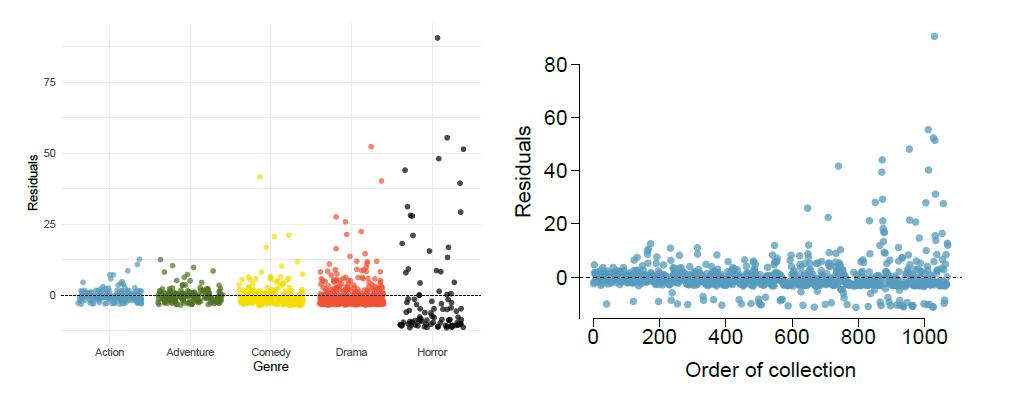
Exercise 9.3 presents a regression model for predicting the average birth weight of babies based on length of gestation, parity, height, weight, and smoking status of the mother. Determine if the model assumptions are met using the plots below. If not, describe how to proceed with the analysis.Data
The scatterplot below summarizes husbands' and wives' heights in a random sample of 170 married couples in Britain, where both partners' ages are below 65 years. Summary output of the least squares fit for predicting wife's height from husband's height is also provided in the table.(a) Is there
What would be the correlation between the annual salaries of males and females at a company if for a certain type of position men always made(a) $5,000 more than women?(b) 25% more than women?(c) 15% less than women?
Consider a regression predicting weight (kg) from height (cm) for a sample of adult males. What are the units of the correlation coefficient, the intercept, and the slope?
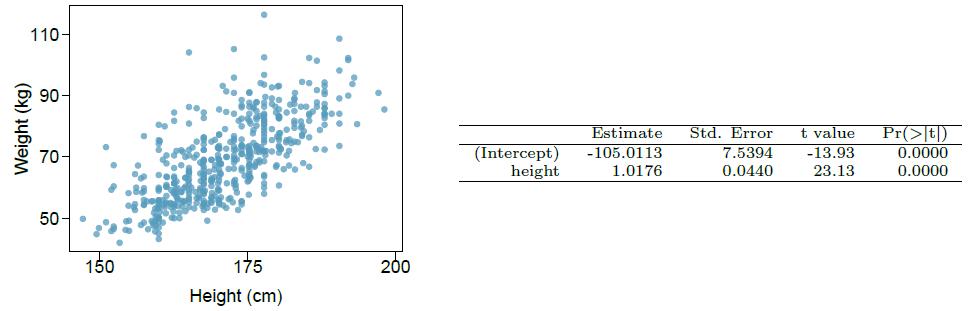
The scatterplot and least squares summary below show the relationship between weight measured in kilograms and height measured in centimeters of 507 physically active individuals.(a) Describe the relationship between height and weight.(b) Write the equation of the regression line. Interpret the
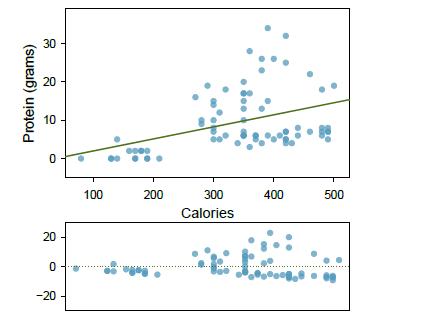
Exercise 8.22 introduced a data set on nutrition information on Starbucks food menu items. Based on the scatterplot and the residual plot provided, describe the relationship between the protein content and calories of these menu items, and determine if a simple linear model is appropriate to
Determine if I or II is higher or if they are equal. Explain your reasoning. For a regression line, the uncertainty associated with the slope estimate, b1, is higher whenI. There is a lot of scatter around the regression line orII. There is very little scatter around the regression line
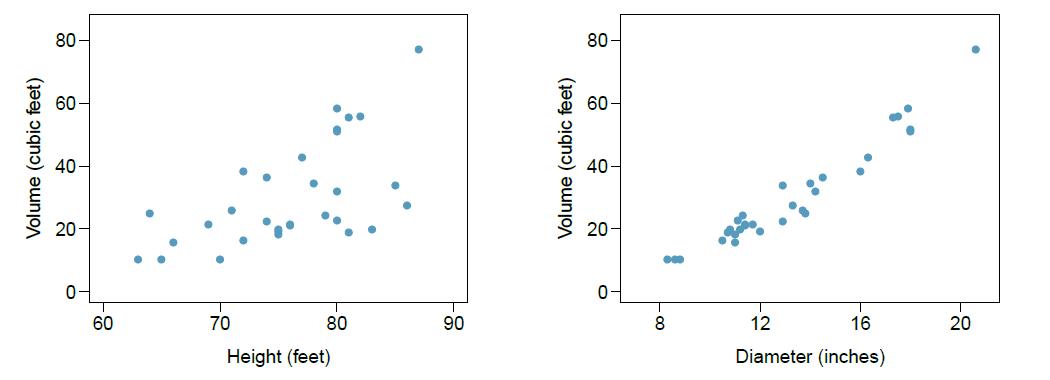
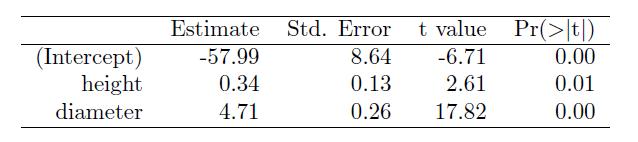
The scatterplots below show the relationship between height, diameter, and volume of timber in 31 felled black cherry trees. The diameter of the tree is measured 4.5 feet above the ground.(a) Describe the relationship between volume and height of these trees.(b) Describe the relationship between
Suppose we fit a regression line to predict the shelf life of an apple based on its weight. For a particular apple, we predict the shelf life to be 4.6 days. The apple's residual is -0.6 days. Did we over or underestimate the shelf-life of the apple? Explain your reasoning.
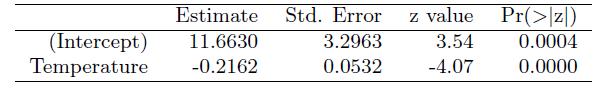
Exercise 8.26 presents regression output from a model for predicting the heart weight (in g) of cats from their body weight (in kg). The coefficients are estimated using a dataset of 144 domestic cat. The model output is also provided below.(a) We see that the point estimate for the slope is
Suppose we fit a regression line to predict the number of incidents of skin cancer per 1,000 people from the number of sunny days in a year. For a particular year, we predict the incidence of skin cancer to be 1.5 per 1,000 people, and the residual for this year is 0.5. Did we over or underestimate
Exercise 8.29 gives a scatterplot displaying the relationship between the percent of families that own their home and the percent of the population living in urban areas. Below is a similar scatterplot, excluding District of Columbia, as well as the residuals plot. There were 51 cases.(a) For these
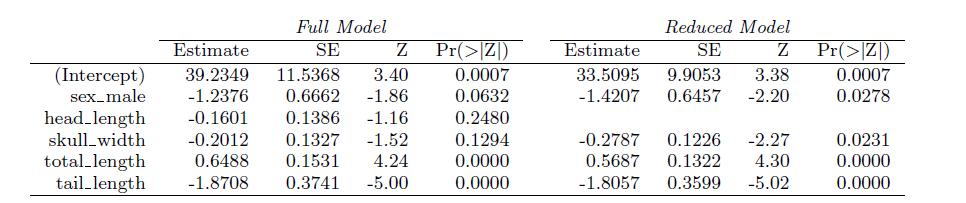
A logistic regression model was proposed for classifying common brushtail possums into their two regions in Exercise 9.15. The outcome variable took value 1 if the possum was from Victoria and 0 otherwise.(a) Write out the form of the model. Also identify which of the variables are positively
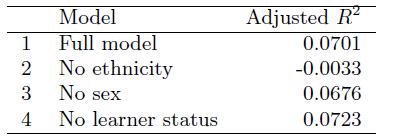
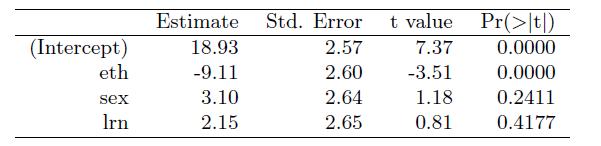
Exercise 9.4 provides regression output for the full model, including all explanatory variables available in the data set, for predicting the number of days absent from school. In this exercise we consider a forward-selection algorithm and add variables to the model one-at-a-time. The table below
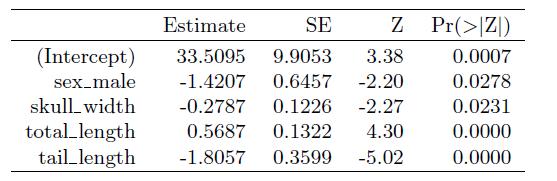
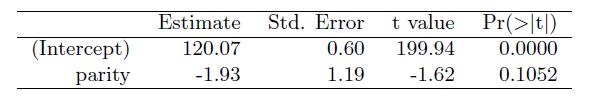
Exercise 9.1 introduces a data set on birth weight of babies. Another variable we consider is parity, which is 1 if the child is the first born, and 0 otherwise. The summary table below shows the results of a linear regression model for predicting the average birth weight of babies, measured in
Exercise 8.13 introduces data on shoulder girth and height of a group of individuals. The mean shoulder girth is 107.20 cm with a standard deviation of 10.37 cm. The mean height is 171.14 cm with a standard deviation of 9.41 cm. The correlation between height and shoulder girth is 0.67.(a) Write
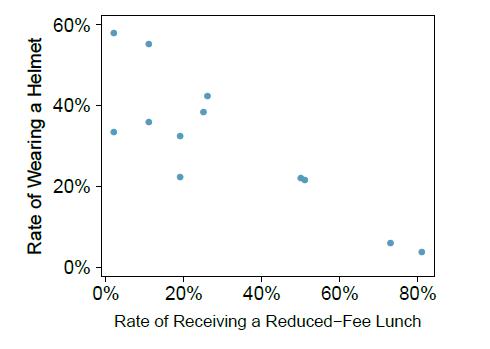
The scatterplot shows the relationship between socioeconomic status measured as the percentage of children in a neighborhood receiving reduced-fee lunches at school (lunch) and the percentage of bike riders in the neighborhood wearing helmets (helmet). The average percentage of children receiving
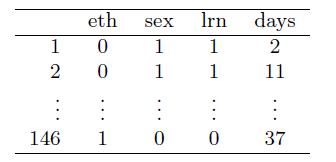
Researchers interested in the relationship between absenteeism from school and certain demographic characteristics of children collected data from 146 randomly sampled students in rural New South Wales, Australia, in a particular school year. Below are three observations from this data set.The
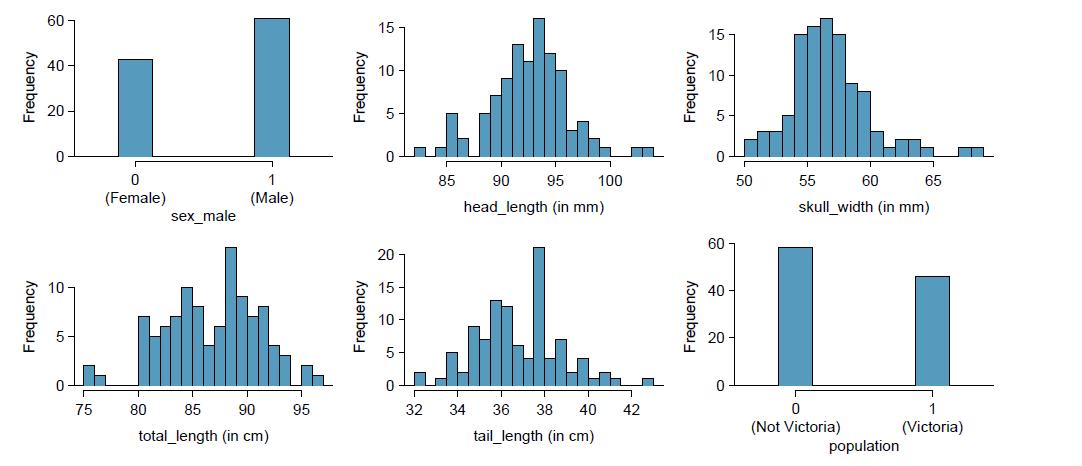
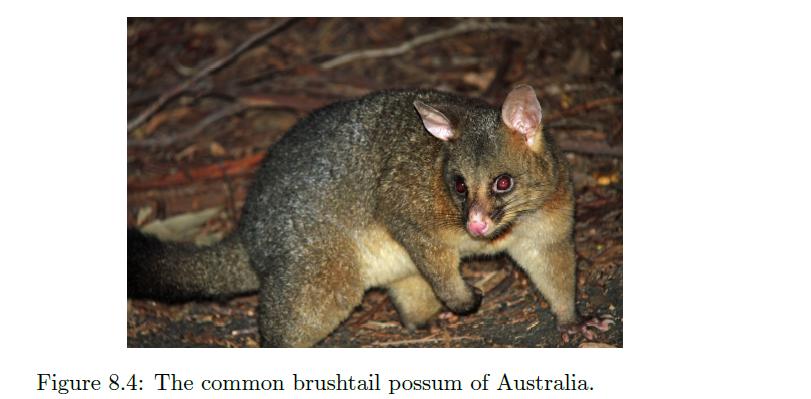
The common brushtail possum of the Australia region is a bit cuter than its distant cousin, the American opossum (see Figure 8.4 on page 307). We consider 104 brushtail possums from two regions in Australia, where the possums may be considered a random sample from the population. The first region
Match each correlation to the corresponding scatterplot.(a) r = -0:72(b) r = 0:07(c) r = 0:86(d) r = 0:99 (1) (2) (3) (4)
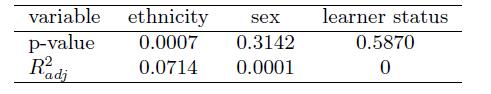
Exercise 9.4 considers a model that predicts the number of days absent using three predictors: ethnic background (eth), gender (sex), and learner status (lrn). The table below shows the adjusted R-squared for the model as well as adjusted R-squared values for all models we evaluate in the first
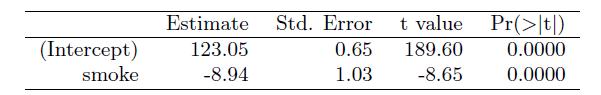
The Child Health and Development Studies investigate a range of topics. One study considered all pregnancies between 1960 and 1967 among women in the Kaiser Foundation Health Plan in the San Francisco East Bay area. Here, we study the relationship between smoking and weight of the baby. The
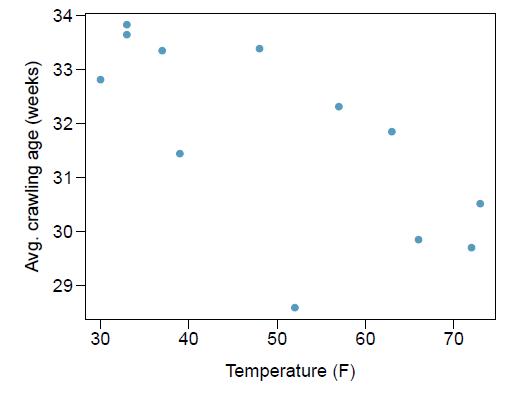
Exercise 8.12 introduces data on the average monthly temperature during the month babies first try to crawl (about 6 months after birth) and the average first crawling age for babies born in a given month. A scatterplot of these two variables reveals a potential outlying month when the average
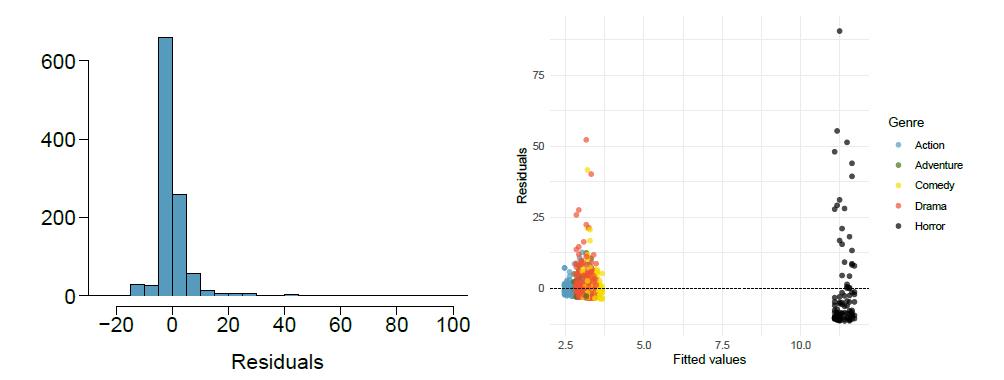
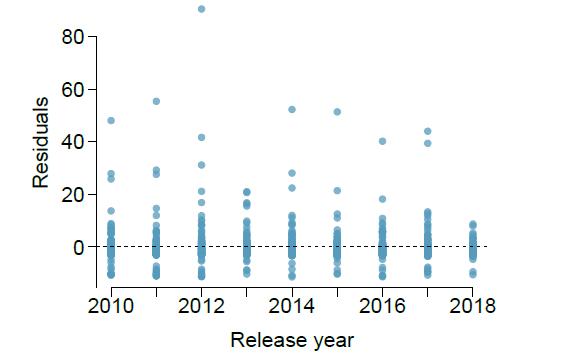
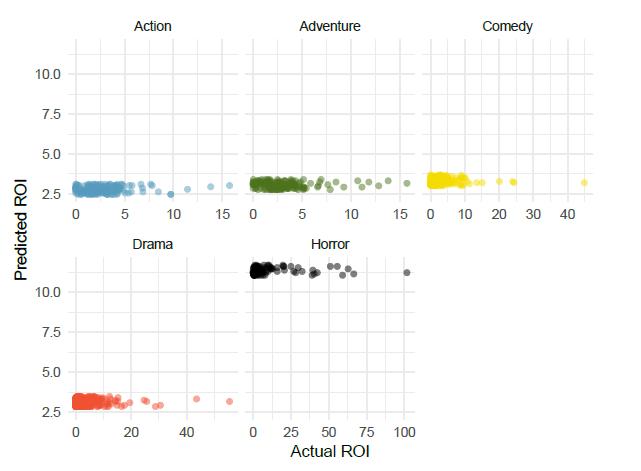
A FiveThirtyEight.com article reports that "Horror movies get nowhere near as much draw at the box office as the big-time summer blockbusters or action/adventure movies ... but there's a huge incentive for studios to continue pushing them out. The return-on-investment potential for horror movies is
Timber yield is approximately equal to the volume of a tree, however, this value is difficult to measure without first cutting the tree down. Instead, other variables, such as height and diameter, may be used to predict a tree's volume and yield. Researchers wanting to understand the relationship
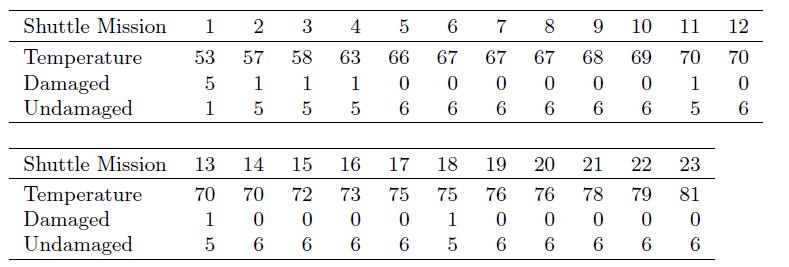
On January 28, 1986, a routine launch was anticipated for the Challenger space shuttle. Seventy-three seconds into the flight, disaster happened: the shuttle broke apart, killing all seven crew members on board. An investigation into the cause of the disaster focused on a critical seal called an
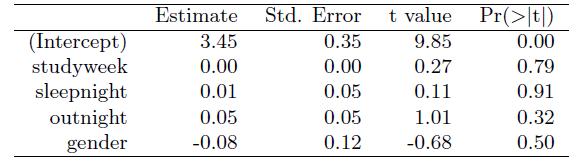
A survey of 55 Duke University students asked about their GPA, number of hours they study at night, number of nights they go out, and their gender. Summary output of the regression model is shown below. Note that male is coded as 1.(a) Calculate a 95% confidence interval for the coefficient of
The student from Exercise 9.14 analyzed return-on-investment (ROI) for movies based on release year and genre of movies. The plots below show the predicted ROI vs. actual ROI for each of the genres separately. Do these figures support the comment in the FiveThirtyEight.com article that states, "The
Determine if the following statements are true or false. If false, explain why.(a) A correlation coefficient of -0.90 indicates a stronger linear relationship than a correlation of 0.5.(b) Correlation is a measure of the association between any two variables.
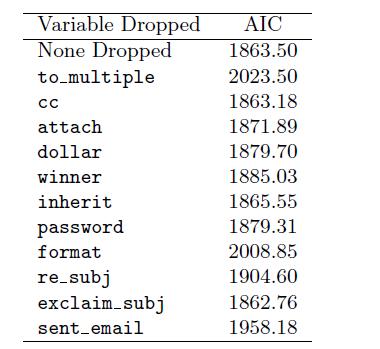
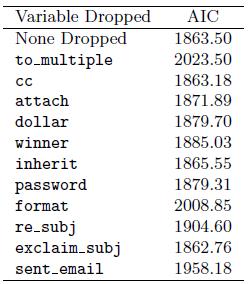
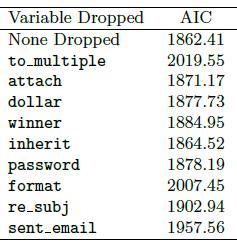
Spam filters are built on principles similar to those used in logistic regression. We fit a probability that each message is spam or not spam. We have several email variables for this problem: to multiple, cc, attach, dollar, winner, inherit, password, format, re subj, exclaim subj, and sent email.
Suppose a social scientist is interested in studying what makes audiences love or hate a movie. She collects a random sample of movies (genre, length, cast, director, budget, etc.) as well as a measure of the success of the movie (score on a film review aggregator website). If as part of her
Suppose an online media streaming company is interested in building a movie recommendation system. The website maintains data on the movies in their database (genre, length, cast, director, budget, etc.) and additionally collects data from their subscribers (demographic information, previously
Determine which of the following statements are true and false. For each statement that is false, explain why it is false.(a) If predictors are collinear, then removing one variable will have no influence on the point estimate of another variable's coefficient.(b) Suppose a numerical variable x has
Determine which of the following statements are true and false. For each statement that is false, explain why it is false.(a) Suppose we consider the first two observations based on a logistic regression model, where the first variable in observation 1 takes a value of x1 = 6 and observation 2 has
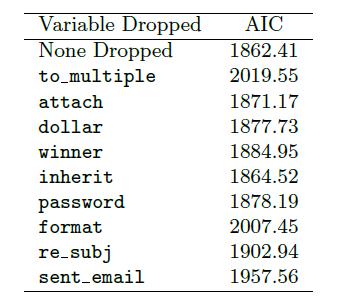
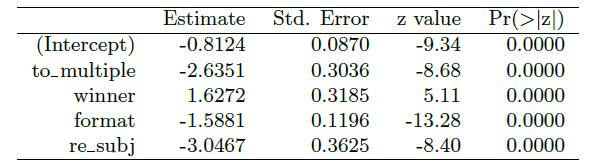
In Exercise 9.21, we encountered a data set where we applied logistic regression to aid in spam classification for individual emails. In this exercise, we've taken a small set of these variables and fit a formal model with the following output:(a) Write down the model using the coefficients from
For each of the following situations, state whether the parameter of interest is a mean or a proportion.(a) A poll shows that 64% of Americans personally worry a great deal about federal spending and the budget deficit.(b) A survey reports that local TV news has shown a 17% increase in revenue
For each of the following situations, state whether the parameter of interest is a mean or a proportion. It may be helpful to examine whether individual responses are numerical or categorical.(a) In a survey, one hundred college students are asked how many hours per week they spend on the
Heights of 10 year olds, regardless of gender, closely follow a normal distribution with mean 55 inches and standard deviation 6 inches.(a) What fraction of 10 year olds are taller than 76 inches?(b) If there are 2,000 10 year olds entering Six Flags Magic Mountain in a single day, then compute the
Heights of 10 year olds, regardless of gender, closely follow a normal distribution with mean 55 inches and standard deviation 6 inches.(a) The height requirement for Batman the Ride at Six Flags Magic Mountain is 54 inches. What percent of 10 year olds cannot go on this ride?(b) Suppose there are
Suppose you're considering buying your expensive chemistry textbook on Ebay. Looking at past auctions suggests that the prices of this textbook follow an approximately normal distribution with mean $89 and standard deviation $15.(a) What is the probability that a randomly selected auction for this
Heights of 10 year olds, regardless of gender, closely follow a normal distribution with mean 55 inches and standard deviation 6 inches.(a) What is the probability that a randomly chosen 10 year old is shorter than 48 inches?(b) What is the probability that a randomly chosen 10 year old is between
Suppose weights of the checked baggage of airline passengers follow a nearly normal distribution with mean 45 pounds and standard deviation 3.2 pounds. Most airlines charge a fee for baggage that weigh in excess of 50 pounds. Determine what percent of airline passengers incur this fee.
Pew Research reported that the typical response rate to their surveys is only 9%. If for a particular survey 15,000 households are contacted, what is the probability that at least 1,500 will agree to respond?
The American Community Survey estimates that 47.1% of women ages 15 years and over are married.(a) We randomly select three women between these ages. What is the probability that the third woman selected is the only one who is married?(b) What is the probability that all three randomly selected
SAT scores (out of 1600) are distributed normally with a mean of 1100 and a standard deviation of 200. Suppose a school council awards a certificate of excellence to all students who score at least 1350 on the SAT, and suppose we pick one of the recognized students at random. What is the
Suppose a newspaper article states that the distribution of auto insurance premiums for residents of California is approximately normal with a mean of $1,650. The article also states that 25% of California residents pay more than $1,800.(a) What is the Z-score that corresponds to the top 25% (or
Exercise 4.36 states that the distribution of speeds of cars traveling on the Interstate 5 Freeway (I-5) in California is nearly normal with a mean of 72.6 miles/hour and a standard deviation of 4.78 miles/hour. The speed limit on this stretch of the I-5 is 70 miles/hour.(a) A highway patrol
Suppose a university announced that it admitted 2,500 students for the following year's freshman class. However, the university has dorm room spots for only 1,786 freshman students. If there is a 70% chance that an admitted student will decide to accept the offer and attend this university, what is
The distribution of passenger vehicle speeds traveling on the Interstate 5 Freeway (I-5) in California is nearly normal with a mean of 72.6 miles/hour and a standard deviation of 4.78 miles/hour.(a) What percent of passenger vehicles travel slower than 80 miles/hour?(b) What percent of passenger
In the game of roulette, a wheel is spun and you place bets on where it will stop. One popular bet is that it will stop on a red slot; such a bet has an 18/38 chance of winning. If it stops on red, you double the money you bet. If not, you lose the money you bet. Suppose you play 3 times, each time
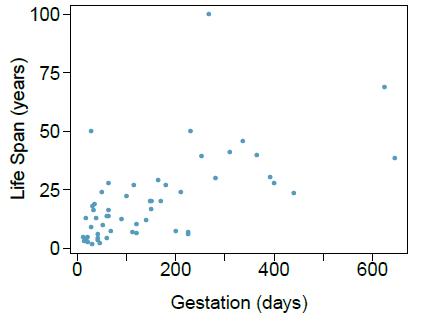
Data were collected on life spans (in years) and gestation lengths (in days) for 62 mammals. A scatterplot of life span versus length of gestation is shown below(a) What type of an association is apparent between life span and length of gestation?(b) What type of an association would you expect to
For Monday through Thursday when there isn't a holiday, the average number of vehicles that visit a particular retailer between 2pm and 3pm each afternoon is 6.5, and the number of cars that show up on any given day follows a Poisson distribution.(a) What is the probability that exactly 5 cars will
A very skilled court stenographer makes one typographical error (typo) per hour on average.(a) What probability distribution is most appropriate for calculating the probability of a given number of typos this stenographer makes in an hour?(b) What are the mean and the standard deviation of the
A coffee shop serves an average of 75 customers per hour during the morning rush.(a) Which distribution have we studied that is most appropriate for calculating the probability of a given number of customers arriving within one hour during this time of day?(b) What are the mean and the standard
A not-so-skilled volleyball player has a 15% chance of making the serve, which involves hitting the ball so it passes over the net on a trajectory such that it will land in the opposing team's court. Suppose that her serves are independent of each other.(a) What is the probability that on the 10th
For a sociology class project you are asked to conduct a survey on 20 students at your school. You decide to stand outside of your dorm's cafeteria and conduct the survey on a random sample of 20 students leaving the cafeteria after dinner one evening. Your dorm is comprised of 45% males and 55%
Calculate the following probabilities and indicate which probability distribution model is appropriate in each case. A very good darts player can hit the bull's eye (red circle in the center of the dart board) 65% of the time. What is the probability that he(a) Hits the bullseye for the 10th time
Calculate the following probabilities and indicate which probability distribution model is appropriate in each case. You roll a fair die 5 times. What is the probability of rolling(a) The first 6 on the fifth roll?(b) Exactly three 6s?(c) The third 6 on the fifth roll?
While it is often assumed that the probabilities of having a boy or a girl are the same, the actual probability of having a boy is slightly higher at 0.51. Suppose a couple plans to have 3 kids.(a) Use the binomial model to calculate the probability that two of them will be boys.(b) Write out all
We learned in Exercise 4.18 that about 90% of American adults had chickenpox before adulthood. We now consider a random sample of 120 American adults.(a) How many people in this sample would you expect to have had chickenpox in their childhood? And with what standard deviation?(b) Would you be
The formula for the number of ways to arrange n objects is n! = n * (n - 1) * · · · * 2 * 1. This exercise walks you through the derivation of this formula for a couple of special cases.A small company has ve employees: Anna, Ben, Carl, Damian, and Eddy. There are five parking spots in a row at
Exercise 4.13 introduces a husband and wife with brown eyes who have 0.75 probability of having children with brown eyes, 0.125 probability of having children with blue eyes, and 0.125 probability of having children with green eyes.(a) What is the probability that their first child will have green
Sickle cell anemia is a genetic blood disorder where red blood cells lose their exibility and assume an abnormal, rigid, "sickle" shape, which results in a risk of various complications. If both parents are carriers of the disease, then a child has a 25% chance of having the disease, 50% chance of
We learned in Exercise 4.17 that about 70% of 18-20 year olds consumed alcoholic beverages in any given year. We now consider a random sample of fifty 18-20 year olds.(a) How many people would you expect to have consumed alcoholic beverages? And with what standard deviation?(b) Would you be
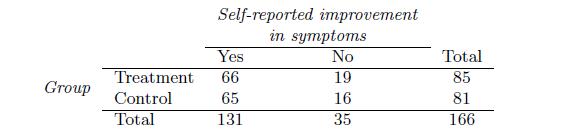
Exercise 1.2 introduced a study exploring the effect of antibiotic treatment for acute sinusitis. Study participants either received either a 10-day course of an antibiotic (treatment) or a placebo similar in appearance and taste (control). At the end of the 10-day period, patients were asked if
Indicate which of the plots show (a) A positive association, (b) A negative association, or (c) No association. Also determine if the positive and negative associations are linear or nonlinear. Each part may refer to more than one plot. (1) (2) (3) ດ ແdogໃຊື້ປ9 99 (4)
On a large college campus first-year students and sophomores live in dorms located on the eastern part of the campus and juniors and seniors live in dorms located on the western part of the campus. Suppose you want to collect student opinions on a new housing structure the college administration is
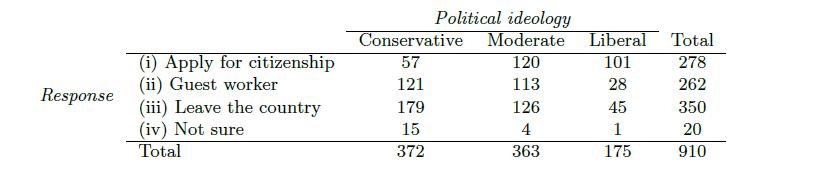
910 randomly sampled registered voters from Tampa, FL were asked if they thought workers who have illegally entered the US should be (i) allowed to keep their jobs and apply for US citizenship, (ii) allowed to keep their jobs as temporary guest workers but not allowed to apply for US citizenship,
A study that surveyed a random sample of otherwise healthy high school students found that they are more likely to get muscle cramps when they are stressed. The study also noted that students drink more coffee and sleep less when they are stressed. (a) What type of study is this? (b) Can
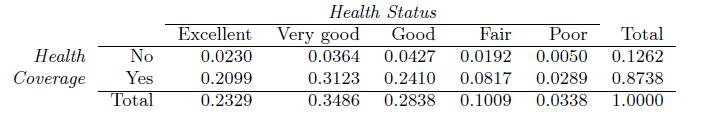
The Behavioral Risk Factor Surveillance System (BRFSS) is an annual telephone survey designed to identify risk factors in the adult population and report emerging health trends. The following table displays the distribution of health status of respondents to this survey (excellent, very good, good,
A university wants to determine what fraction of its undergraduate student body support a new $25 annual fee to improve the student union. For each proposed method below, indicate whether the method is reasonable or not.(a) Survey a simple random sample of 500 students.(b) Stratify students by
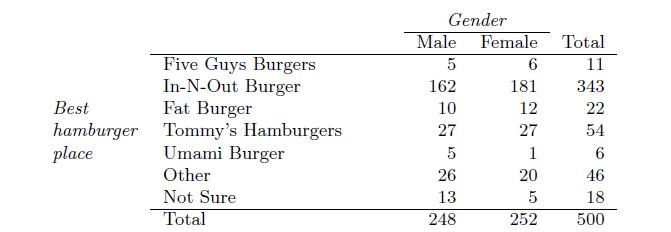
A 2010 SurveyUSA poll asked 500 Los Angeles residents, "What is the best hamburger place in Southern California? Five Guys Burgers? In-N-Out Burger? Fat Burger? Tommy's Hamburgers? Umami Burger? Or somewhere else?" The distribution of responses by gender is shown below.(a) Are being female and
Showing 1100 - 1200
of 1303
1
2
3
4
5
6
7
8
9
10
11
12
13
14
Step by Step Answers