

Refer to the randomization test described in Exercise 5.72 for the correlation between uniform malevolence and penalty
Question:
(a) Identify a clear error in the process that the student has used to construct a confidence interval for the correlation in this situation.
(b) Suggest a more appropriate method for estimating the standard error to find a confidence interval for the correlation between uniform malevolence and standardized penalty minutes for NHL teams, based on the sample data in MalevolentUniformsNHL.
(c) Carry out the procedure you describe in part (b) to obtain an estimate of the standard error. Assuming that a normal distribution is appropriate, use the standard error to find (and interpret) a 90% confidence interval for the correlation in this context.
(d) Does it look like a normal distribution is appropriate in this situation? Explain why or why not.
Exercise 5.72
Data 4.3 on page 224
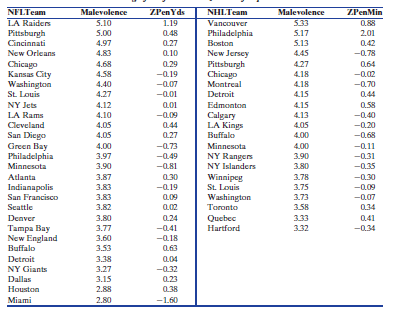
Frank and Gilovich4 describe a study of relationships between the type of uniforms worn by professional sports teams and the aggressiveness of the team. They consider teams from the National Football League (NFL) and National Hockey League (NHL). Participants with no knowledge of the teams rated the jerseys on characteristics such as timid/aggressive, nice/mean, and good/bad. The averages of these responses produced a €˜€˜malevolence€ index with higher scores signifying impressions of more malevolent (evil-looking) uniforms. To measure aggressiveness, the authors used the amount of penalties (yards for football and minutes for hockey) converted to z-scores and averaged for each team over the seasons from 1970 to 1986. The data are shown in Table 4.1 and stored in MalevolentUniformsNFL and MalevolentUniformsNHL.
Table 4.1
The word "distribution" has several meanings in the financial world, most of them pertaining to the payment of assets from a fund, account, or individual security to an investor or beneficiary. Retirement account distributions are among the most...
Step by Step Answer:
a The randomization distribution is formed under the assumption that the null hypothesis H 0 0 is tr...View the full answer


Statistics Unlocking The Power Of Data
ISBN: 9780470601877
1st Edition
Authors: Robin H. Lock, Patti Frazer Lock, Kari Lock Morgan, Eric F. Lock, Dennis F. Lock
