

Question: Show a boxplot for a set of data. In each case: (a) Indicate whether the distribution of the data appears to be skewed to the
Show a boxplot for a set of data. In each case:
(a) Indicate whether the distribution of the data appears to be skewed to the left, skewed to the right, approximately symmetric, or none of these.
(b) Are there any outliers? If so, how many and are they high outliers or low outliers?
(c) Give a rough approximation for the mean of the dataset.
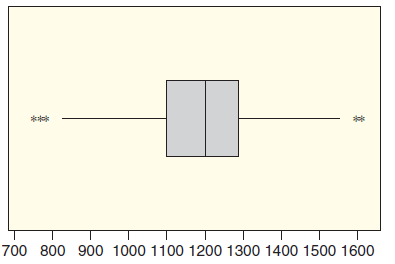
**** 700 800 900 1000 1100 1200 1300 1400 1500 1600
Step by Step Solution
3.58 Rating (165 Votes )
There are 3 Steps involved in it
a This distribution isnt perfectly symmetric but it is close Despite the presence of o... View full answer

Get step-by-step solutions from verified subject matter experts