

Question: Show a boxplot for a set of data. In each case: (a) Indicate whether the distribution of the data appears to be skewed to the
Show a boxplot for a set of data. In each case:
(a) Indicate whether the distribution of the data appears to be skewed to the left, skewed to the right, approximately symmetric, or none of these.
(b) Are there any outliers? If so, how many and are they high outliers or low outliers?
(c) Give a rough approximation for the mean of the dataset.
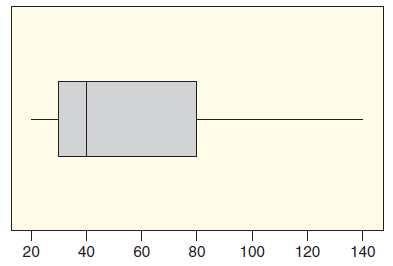
20 40 60 80 100 120 140
Step by Step Solution
★★★★★
3.40 Rating (159 Votes )
There are 3 Steps involved in it
1 Expert Approved Answer
Step: 1 Unlock

a Half of the data appears to lie in the small area between 20 and 40 while the other half the ri... View full answer
Question Has Been Solved by an Expert!
Get step-by-step solutions from verified subject matter experts
Step: 2 Unlock
Step: 3 Unlock