

Question: Use StatKey or other technology to create a randomization distribution for the paired data in the quizlecture pulse test described in Exercise 4.141. Find the
Use StatKey or other technology to create a randomization distribution for the paired data in the quiz€“lecture pulse test described in Exercise 4.141. Find the p-value for the original sample and determine if there is sufficient evidence to conclude that the mean pulse rate during a quiz is larger than the mean pulse rate during lecture.
Exercise 4.141
Do you think that students undergo physiological changes when in potentially stressful situations such as taking a quiz or exam? A sample of statistics students were interrupted in the middle of a quiz and asked to record their pulse rates (beats for a 1-minute period). Ten of the students had also measured their pulse rate while sitting in class listening to a lecture, and these values were matched with their quiz pulse rates. The data appear in Table 4.16 and are stored in QuizPulse10. Note that this is paired data since we have two values, a quiz and a lecture pulse rate, for each student in the sample. The question of interest is whether quiz pulse rates tend to be higher, on average, than lecture pulse rates.
Table 4.16
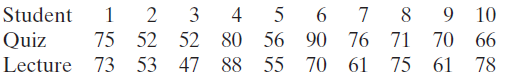
Student Quiz 9 10 3 80 56 90 76 71 70 66 52 88 55 70 61 8 75 52 53 47 75 61 78 Lecture 73
Step by Step Solution
3.61 Rating (183 Votes )
There are 3 Steps involved in it
We are interested in whether pulse rates are higher on average during a quiz than during a lecture s... View full answer

Get step-by-step solutions from verified subject matter experts