

Question: Using the sampling distribution shown in Figure 3.5(a), how likely are these sample proportions: Figure 3.5 a. (a) pÌ = 0.1 (b) pÌ = 0.35
Figure 3.5
a.
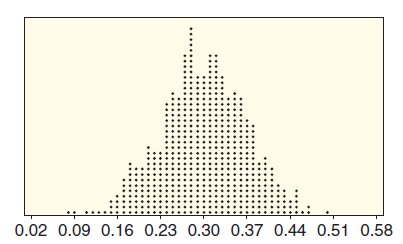
(a) p̂ = 0.1
(b) p̂ = 0.35
(c) p̂ = 0.6
Refer to the sampling distributions given in Figure 3.5. Several possible values are given for a sample statistic. In each case, indicate whether each value is
(i) Reasonably likely to occur from a sample of this size,
(ii) Unusual but might occur occasionally,
(iii) Extremely unlikely to ever occur.
0.02 0.09 0.16 0.23 0.30 0.37 0.44 0.51 0.58
Step by Step Solution
★★★★★
3.30 Rating (159 Votes )
There are 3 Steps involved in it
1 Expert Approved Answer
Step: 1 Unlock

a We see in the sampling distribution that a sample proport... View full answer
Question Has Been Solved by an Expert!
Get step-by-step solutions from verified subject matter experts
Step: 2 Unlock
Step: 3 Unlock