

Question: Using the sampling distribution shown in Figure 3.5(d), how likely are these sample proportions: Figure 3.5 d. (a) pÌ = 0.72 (b) pÌ = 0.88
Using the sampling distribution shown in Figure 3.5(d), how likely are these sample proportions:
Figure 3.5 d.
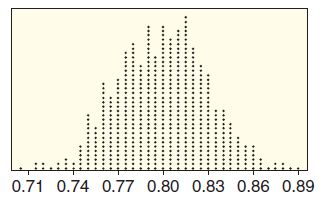
(a) p̂ = 0.72
(b) p̂ = 0.88
(c) p̂ = 0.95
Refer to the sampling distributions given in Figure 3.5. Several possible values are given for a sample statistic. In each case, indicate whether each value is (i) reasonably likely to occur from a sample of this size, (ii) unusual but might occur occasionally, or (iii) extremely unlikely to ever occur.
0.71 0.74 0.77 0.80 0.83 0.86 0.89
Step by Step Solution
3.45 Rating (155 Votes )
There are 3 Steps involved in it
a We see in the sampling distribution that a sample proportion of p ... View full answer

Get step-by-step solutions from verified subject matter experts