

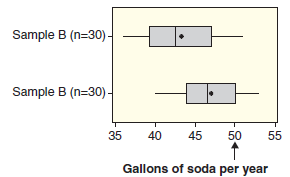
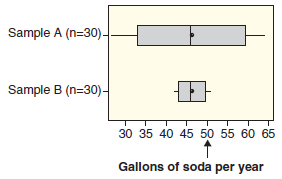
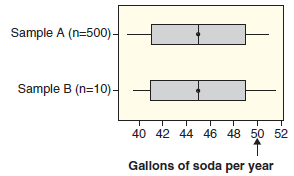
We extend the situation described in Exercise B.24 to each of the pairs of boxplots in Figure
Question:
Figure B.9
a.
b.
c.
Exercise B.24
The average American drinks approximately 50 gallons of soda (pop) a year, delivering approximately 50,000 calories and no nutrition. Some legislators are recommending instituting a sales tax on soda to raise revenue and fight obesity. Will a sales tax impact consumption? Suppose that a sales tax on soda will be added in a random sample of communities to measure the impact on soda consumption. We wish to determine whether average per-capita consumption of taxed soda is significantly less than 50 gallons a year. Figure B.8 shows dotplots of three pairs of possible sample results. In each case, indicate whether the results of Sample A or Sample B show stronger evidence that average consumption of taxed soda is below 50, or state that neither sample shows evidence that the mean is below 50. Explain your reasoning in each case.
Step by Step Answer:
a Sample A The sample mean in A is around 43 while the sample ...View the full answer


Statistics Unlocking The Power Of Data
ISBN: 9780470601877
1st Edition
Authors: Robin H. Lock, Patti Frazer Lock, Kari Lock Morgan, Eric F. Lock, Dennis F. Lock
