

(a) Use the figure to construct two scatter diagrams, one for dry pavement and the other for...
Question:
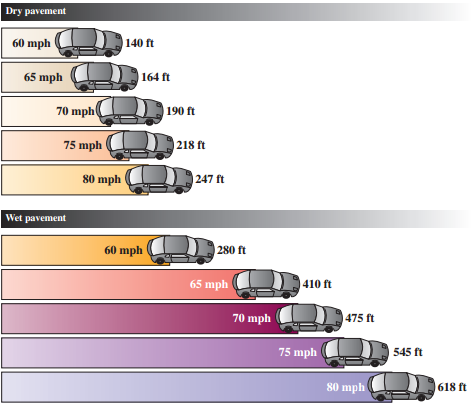
(a) Use the figure to construct two scatter diagrams, one for dry pavement and the other for wet pavement. Place the speed of the car on the horizontal axis.
(b) Compute the correlation coefficient for the speed of the car and the stopping distance for dry pavement.
(c) Were your answers to parts (a) and (b) correct? Explain.
(d) Determine the equation of the line of best fit for dry pavement.
(e) Repeat part (g) for wet pavement.
(f) Use the equations in parts (g) and (h) to estimate the stopping distance of a car going 77 mph on both dry and wet pavements.
Hitting the brakes:
At high speed on a wet road, a typical midsize car may need a distance longer than two football fields to come to a stop.
Braking distance at given mph.
Round both m and b the nearest hundredth.
Step by Step Answer:
a b The values in the last row of the calculation table are c The values ...View the full answer


A Survey of Mathematics with Applications
ISBN: 978-0134112107
10th edition
Authors: Allen R. Angel, Christine D. Abbott, Dennis Runde
