

Question: Draw the Bewley lattice diagram for Problem 13.5, and plot (v(l / 3, t)) versus time (t) for (0 leqslant t leqslant 5 tau). Also
Draw the Bewley lattice diagram for Problem 13.5, and plot \(v(l / 3, t)\) versus time \(t\) for \(0 \leqslant t \leqslant 5 \tau\). Also plot \(v(x, 3 \tau)\) versus \(x\) for \(0 \leqslant x \leqslant l\).
Data From Problem 13.5:-
Rework Example 13.4 with \(\mathrm{Z}_{\mathrm{R}}=4 \mathrm{Z}_{c}\) and \(\mathrm{Z}_{\mathrm{G}}=\mathrm{Z}_{c} / 3\).
Data From Example 13.4:-
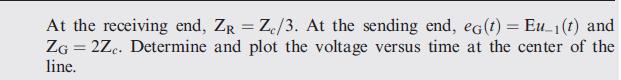
At the receiving end, ZR = Ze/3. At the sending end, eG(t) = Eu_1(t) and ZG = 2Zc. Determine and plot the voltage versus time at the center of the line.
Step by Step Solution
★★★★★
3.31 Rating (160 Votes )
There are 3 Steps involved in it
1 Expert Approved Answer
Step: 1 Unlock

Question Has Been Solved by an Expert!
Get step-by-step solutions from verified subject matter experts
Step: 2 Unlock
Step: 3 Unlock