

Question: For the triangular factorization of the corresponding (boldsymbol{Y}_{text {bus }}), number the nodes of the graph shown in Figure 6.9 in an optimal order. Figure
For the triangular factorization of the corresponding \(\boldsymbol{Y}_{\text {bus }}\), number the nodes of the graph shown in Figure 6.9 in an optimal order.
Figure 6.9
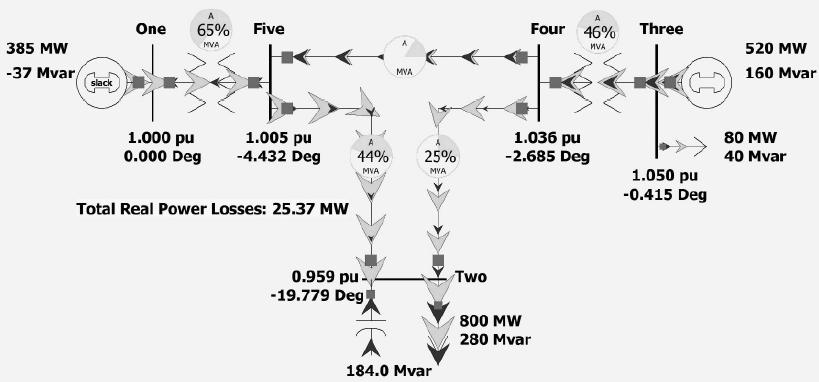
385 MW -37 Mvar slack One 65% Five MVA 1.000 pu 0.000 Deg 1.005 pu -4.432 Deg Total Real Power Losses: 25.37 MW 44% MVA 0.959 pu- -19.779 Deg A MVA 25% MVA 184.0 Mvar Two A Four 46% MVA 1.036 pu -2.685 Deg 800 MW 280 Mvar Three 1.050 pu -0.415 Deg 520 MW 160 Mvar 80 MW 40 Mvar
Step by Step Solution
★★★★★
3.38 Rating (160 Votes )
There are 3 Steps involved in it
1 Expert Approved Answer
Step: 1 Unlock

Question Has Been Solved by an Expert!
Get step-by-step solutions from verified subject matter experts
Step: 2 Unlock
Step: 3 Unlock