

Question: Use Multisim to study how the voltage across the circuit in Figure P (7-41) changes as the value of the resistor is varied. Let (L=1
Use Multisim to study how the voltage across the circuit in Figure P \(7-41\) changes as the value of the resistor is varied. Let \(L=1 \mathrm{H}, C=1 \mu \mathrm{F}, R=500 \Omega\), and \(v_{\mathrm{C}}(\mathrm{O})=-10 \mathrm{~V}\). Under "Analyses" perform a "Parameter sweep." The parameter we wish to sweep is the resistor \(\mathrm{R}\). We select it under "Device type." The resistor parameter we wish to sweep is its "resistance." The nominal value you assigned to it will appear as its "present value" but it does not play any role in the analysis. Next, we need to tell it what type of sweep we want it to perform. We will use "Decade" under "Sweep variation type." We will then include the values of \(R\) that we want Multisim to use in doing the transient analysis, that is, vary the resistor from \(10 \Omega\) to \(10 \mathrm{k} \Omega\) by 3 points per decade. This will generate a family of curves corresponding to different values of resistance. By clicking on the various curves, determine if the response becomes more or less damped as \(R\) varies from \(10 \Omega\) to \(10 \mathrm{k} \Omega\). By looking at the curves, can you tell about what value of resistance will produce a critically damped circuit? Verify your guess by actually calculating the value of \(R\) that yields \(\zeta=1\).
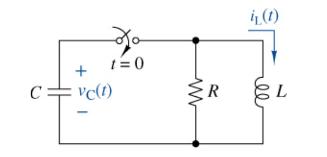
t=0 + vc(1) {R il (1) L
Step by Step Solution
3.33 Rating (168 Votes )
There are 3 Steps involved in it
The Multisim simulation and results are shown in the figure below Voltage V 100000 80000 6... View full answer

Get step-by-step solutions from verified subject matter experts