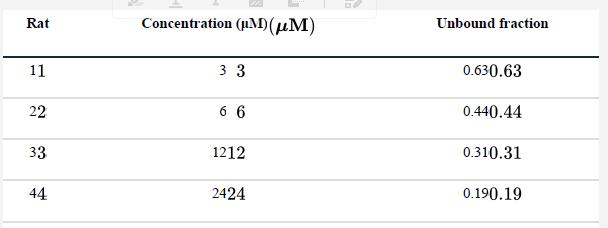
The following data are from a laboratory experiment by Smallwood et al. (1998) in which liver preparations
Question:
The following data are from a laboratory experiment by Smallwood et al. (1998) in which liver preparations from five rats were used to measure the relationship between the administered concentration of taurocholate (a salt normally occurring in liver bile) and the unbound fraction of taurocholate in the liver.

![]()
a. Calculate the correlation coefficient between the taurocholate unbound fraction and the concentration.
b. Plot the relationship between the two variables in a graph.
c. Examine the plot in part (b). The relationship appears to be maximally strong, yet the correlation coefficient you calculated in part (a) is not near the maximum possible value. Why not?
d. What steps would you take with these data to meet the assumptions of correlation analysis?
Step by Step Answer:

The Analysis Of Biological Data
ISBN: 9781319226237
3rd Edition
Authors: Michael C. Whitlock, Dolph Schluter


