

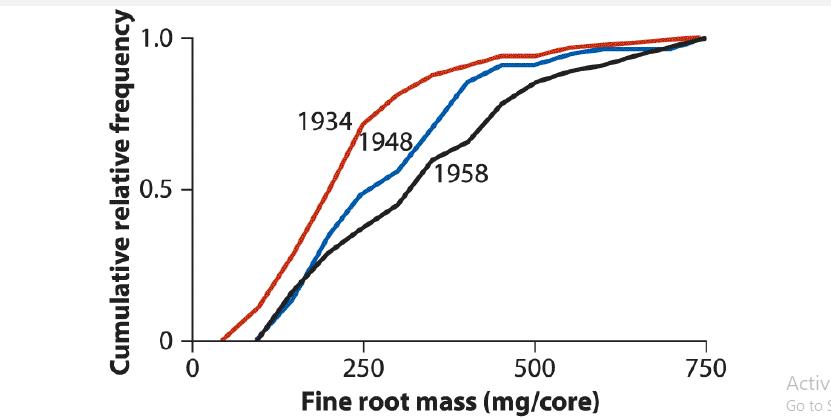
The following graph illustrates an association between two variables. The graph shows density of fine roots in
Question:
The following graph illustrates an association between two variables. The graph shows density of fine roots in Monterey pines (Pinus radiata) planted in three different years of study (redrawn from Moir and Bachelard 1969, with permission). Identify
(a) The type of graph,
(b) The explanatory and response variables, and
(c) The type of data (whether numerical or categorical) for each variable.
Fantastic news! We've Found the answer you've been seeking!
Step by Step Answer:
a The Type of Graph The graph is a cumulative frequency distribution or cumulative relative frequenc...View the full answer

Answered By
David Muchemi
I am a professional academic writer with considerable experience in writing business and economic related papers. I have been writing for my clients who reach out to me personally after being recommended to me by satisfied clients.
I have the English language prowess, no grammatical and spelling errors can be found in my work. I double-check for such mistakes before submitting my papers.
I deliver finished work within the stipulated time and without fail. I am a good researcher on any topic especially those perceived to be tough.
I am ready to work on your papers and ensure you receive the highest quality you are looking for. Please hire me to offer my readily available quality service.
Best regards,
27+ Reviews
61+ Question Solved
Related Book For 

The Analysis Of Biological Data
ISBN: 9781319226237
3rd Edition
Authors: Michael C. Whitlock, Dolph Schluter
Question Posted:
