

Question: Summarize the problems that a manager would encounter in interpreting a standard sensitivity analysis, such as the one shown in Table 10.2. Which of these
Summarize the problems that a manager would encounter in interpreting a standard sensitivity analysis, such as the one shown in Table 10.2. Which of these problems are alleviated by examining the project under alternative scenarios?
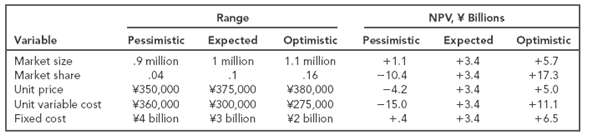
NPV, V Billions Range Expected 1 million Variable Pessimistic Optimistic 1.1 million .16 380,000 275,000 2 billion Expected Optimistic Pessimistic 9 million 04 Market size Market share Unit price Unit variable cost Fixed cost +3.4 +3.4 +3.4 +3.4 +3.4 +5.7 +17.3 +5.0 +1.1 -10.4 -4.2 -15.0 +.4 .1 350,000 375,000 300,000 +11.1 +6.5 4 billion 3 billion
Step by Step Solution
3.27 Rating (171 Votes )
There are 3 Steps involved in it
a Optimistic and pessimistic rarely show the full probab... View full answer

Get step-by-step solutions from verified subject matter experts
Document Format (1 attachment)
35-B-C-F-C-B (127).docx
120 KBs Word File