

Question: Table 7.8 shows standard deviations and correlation coefficients for seven stocks from different countries. Calculate the variance of a portfolio 40 percent invested in BP,
Table 7.8 shows standard deviations and correlation coefficients for seven stocks from different countries. Calculate the variance of a portfolio 40 percent invested in BP, 40 percent invested in KLM, and 20 percent invested in Nestl?.
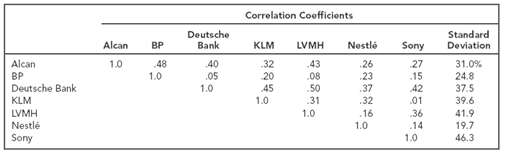
Correlation Coefficients Deutsche Bank Standard Alcan Deviation KLM LVMH Nestl 26 23 37 .32 .16 1.0 Sony 27 15 42 .01 36 .14 1.0 BP Alcan BP Deutsche Bank KLM LVMH Nestl 40 1.0 48 1.0 31.0% 24.8 37.5 39.6 41.9 19.7 46.3 32 43 08 50 20 45 1.0 05 1.0 31 1.0 Sony
Step by Step Solution
3.31 Rating (172 Votes )
There are 3 Steps involved in it
XP 04 XKLM 04 XN 02 2 0 XE XKLM KIM Xn ... View full answer

Get step-by-step solutions from verified subject matter experts
Document Format (1 attachment)
35-B-C-F-R-A-R (116).docx
120 KBs Word File