

Question: The output below is from the regression analysis linking monthly changes in weight (y weight change in ounces) to daily exercise (x 1 minutes of
The output below is from the regression analysis linking monthly changes in weight (y weight change in ounces) to daily exercise (x1 minutes of strenuous daily exercise) and daily fat calorie intake (x2 number of fat calories consumed daily). The sample consisted of 28 men in the 25 to 35 year age group. Compute the value for the adjusted r2 and explain what it represents.
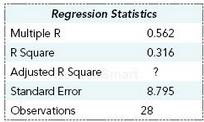
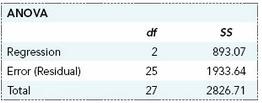
Regression Statistics Multiple R R Square Adjusted R Square Standard Eror Observations 0.562 0.316 8.795 28 ANOVA df Regression Error (Residual) Total 893.07 1933.64 2826.71 25 27
Step by Step Solution
3.38 Rating (164 Votes )
There are 3 Steps involved in it
r 2 adj 1 ... View full answer

Get step-by-step solutions from verified subject matter experts
Document Format (1 attachment)
486-M-S-L-R (3074).docx
120 KBs Word File