

Question: The output below is from a multiple linear regression analysis attempting to link winning percentage (y) to weekly practice time (x 1 ), average speed
The output below is from a multiple linear regression analysis attempting to link winning percentage (y) to weekly practice time (x1), average speed of first serve (x2), and first serve percentage (x3) using data from a group of 12 professional tennis players over the past year. Notice that some of the values in the table are missing.
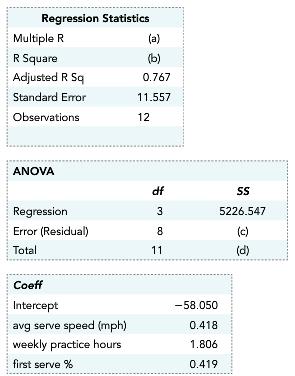
a. Fill in the missing values indicated by ().
b. Identify and interpret the estimated regression coefficients for x1, x2, and x3.
Regression Statistics Multiple R uare Adjusted R Sq Standard Error Observations 0.767 11.557 12 ANOVA df Regressiorn Error (Residual) Total 5226.547 Coeff Intercept avg serve speed (mph) weekly practice hours first serve % -58.050 0.418 1.806 0.419
Step by Step Solution
3.25 Rating (171 Votes )
There are 3 Steps involved in it
a c Since s yx SSE nk 1 s yx 2 123111557 2 1068514 d SST SSR SSE 5226547 1068514 6295061 b ... View full answer

Get step-by-step solutions from verified subject matter experts
Document Format (1 attachment)
486-M-S-L-R (3059).docx
120 KBs Word File