

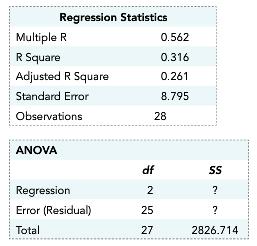
Question: The output below is from a medical study that used multiple linear regression analysis to link monthly changes in weight (y = weight change in
The output below is from a medical study that used multiple linear regression analysis to link monthly changes in weight (y = weight change in ounces) to daily exercise (x1 = minutes of strenuous daily exercise) and daily fat calorie intake (x2 = number of fat calories consumed daily). The sample consisted of 28 men in the 25-to-35-year age group.
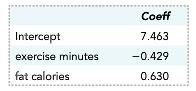
a. Identify and interpret the estimated regression coefficients for x1 and x2.
b. Fill in the values of SSR and SSE.
Regression Statistics Multiple R R Square Adjusted R Square Standard Error Observations 0.562 0.316 0.261 8.795 28 ANOVA df Regression Error (Residual) Total 25 27 2826.714 Coeff 7.463 exercise minutes 0.429 0.630 ntercept fat calories
Step by Step Solution
3.50 Rating (160 Votes )
There are 3 Steps involved in it
a The coefficient for x 1 exercise minutes is 429 i... View full answer

Get step-by-step solutions from verified subject matter experts
Document Format (1 attachment)
486-M-S-L-R (3058).docx
120 KBs Word File