

Question: The stack plot in Figure 3.21 shows the numbers of male and female higher education students for different years. Projections are from the U.S. National
The stack plot in Figure 3.21 shows the numbers of male and female higher education students for different years. Projections are from the U.S. National Center for Education Statistics.
a. In words, discuss the trends revealed on this graphic.
b. Redraw the graph as a multiple line chart. Briefly discuss the advantages and disadvantages of the two different representations of this particular data set.
Figure 3.21
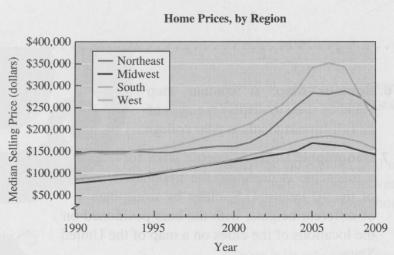
Home Prices, by Region $400,000 $350,000Northeast 300,000South $250,000 $200,000 $150,000 $100,000 $50,000 Midwest West 1 1990 1995 2000 2005 2009 Year
Step by Step Solution
3.33 Rating (165 Votes )
There are 3 Steps involved in it
a Numbers of females consistently outnumber the numbers of males Th... View full answer

Get step-by-step solutions from verified subject matter experts
Document Format (1 attachment)
666-M-S-D-A (5623).docx
120 KBs Word File