

Question: The wave function for the hydrogen-atom quantum state represented by the dot plot shown in figure, which has n = 2 and ? = m?
The wave function for the hydrogen-atom quantum state represented by the dot plot shown in figure, which has n = 2 and ? = m? = 0, is in which a is the Bohr radius and the subscript on ?(r) gives the values of the quantum numbers n, ?, m?.(a) Plot ?2200(r) and show that your plot is consistent with the dot plot of figure.(b) Show analytically that ?2200(r) has a maximum at r = 4a.(c) Find the radial probability density P200(r) for this state.(d) Show that and thus that the expression above for the wave function ?200(r) *zo6(r) has been properly normalized.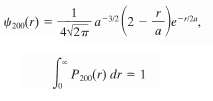
zandr) 4v27 P0(r) dr = 1
Step by Step Solution
3.45 Rating (165 Votes )
There are 3 Steps involved in it
a The plot shown below for 200 is to be compared with the dot plot of Fig 3922 We note that the hori... View full answer

Get step-by-step solutions from verified subject matter experts
Document Format (1 attachment)
18-P-M-P-P-M-W (138).docx
120 KBs Word File