

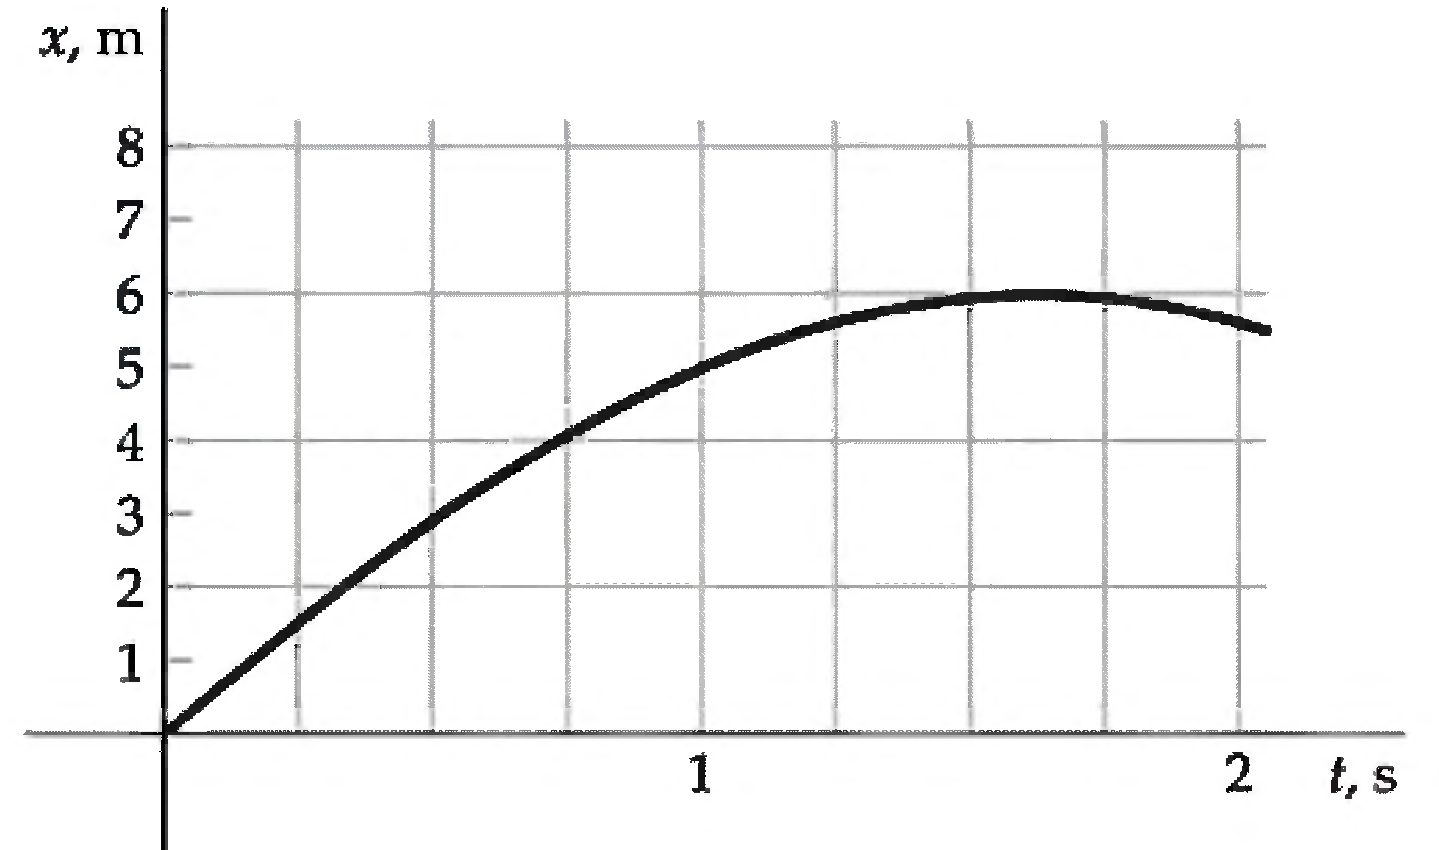
Using the graph of x versus t in Figure, find (a) The average velocity for the time
Question:
Using the graph of x versus t in Figure, find
(a) The average velocity for the time intervals ∆t = t2 − 0.75 s when t2 is 1.75, 1.5, 1.25, and 1.0s;
(b) The instantaneous velocity at t = 0.75 s;
(c) The approximate time when the instantaneous velocity is zero.
Fantastic news! We've Found the answer you've been seeking!
Step by Step Answer:
a Graph find x075 x175 x15 x 075 40 m x175 59 m x15 6 m ...View the full answer

Answered By
Poonam Chaudhary
I have 15 month+ Teaching Experience
2+ Reviews
10+ Question Solved
Related Book For 

Fundamentals of Ethics for Scientists and Engineers
ISBN: 978-0195134889
1st Edition
Authors: Edmund G. Seebauer, Robert L. Barry
Question Posted:
