New Semester
Started
Get
50% OFF
Study Help!
--h --m --s
Claim Now
Question Answers
Textbooks
Find textbooks, questions and answers
Oops, something went wrong!
Change your search query and then try again
S
Books
FREE
Study Help
Expert Questions
Accounting
General Management
Mathematics
Finance
Organizational Behaviour
Law
Physics
Operating System
Management Leadership
Sociology
Programming
Marketing
Database
Computer Network
Economics
Textbooks Solutions
Accounting
Managerial Accounting
Management Leadership
Cost Accounting
Statistics
Business Law
Corporate Finance
Finance
Economics
Auditing
Tutors
Online Tutors
Find a Tutor
Hire a Tutor
Become a Tutor
AI Tutor
AI Study Planner
NEW
Sell Books
Search
Search
Sign In
Register
study help
mathematics
statistics
Business Statistics 3rd Edition Norean Sharpe, Richard Veaux, Paul Velleman - Solutions
For the real estate data of Exercise 1, do the data appear to have come from a designed survey or experiment? What concerns might you have about drawing conclusions from this data set?
A student finds data on an Internet site that contains financial information about selected companies. He plans to analyze the data and use the results to develop a stock investment strategy. What kind of data source is he using? What concerns might you have about drawing conclusions from this data
An automobile manufacturer wants to know what college students think about electric vehicles. They ask you to conduct a survey that asks students, “Do you think there will be more electric or gasoline powered vehicles on the road in 2025?” and “How likely are you to buy an electric vehicle in
As part of the human resource group of your company you are asked to summarize the educational levels of the 512 employees in your division. From company records, you find that 164 have no college degree (None), 42 have an associate’s degree (AA), 225 have a bachelor’s degree (BA), 52 have a
For the table in Exercise 8: a) Find the column percentages. b) Looking at the column percentages in part a, does the distribution of how many times someone has seen the movie look the same for each age group? Comment briefly. c) Make a segmented bar chart, showing the distribution of viewings for
An article in The Wall Street Journal (March 18, 2011) reported the 2010 U.S. market share of leading sellers of carbonated soft drinks, summarized in the following pie chart:a) Is this an appropriate display for these data? Explain. b) Which company had the largest share of the market?
The Wall Street Journal article described in Exercise 15 also indicated the market share of the leading brands of carbonated beverages. The following bar chart displays the values:a) Is this an appropriate display for these data? Explain. b) Which brand had the largest share of the beverage
Here€™s a pie chart of the data in Exercise 16.a) Which display of these data is best for comparing the market shares of these brands? Explain. b) Does Mountain Dew or Dr Pepper have a bigger market share? Is that comparison easier to make with the pie chart or the bar chart of Exercise
An insurance company is updating its payouts and cost structure for their insurance policies. Of particular interest to them is the risk analysis for customers currently on heart or blood pressure medication. The Centers for Disease Control and Prevention (www.cdc.gov) lists causes of death in the
As part of the marketing group at Pixar, you are asked to find out the age distribution of the audience of Pixar’s latest film. With the help of 10 of your colleagues, you conduct exit interviews by randomly selecting people to question at 20 different movie theaters. You ask them to tell you if
In March and April of 2011, the Pew Research Center asked 2142 U.S. adults and 1055 college presidents whether they would €œrate the job the higher education system is doing in providing value for the money spent by students and their families€ as Excellent, Good, Only Fair, or
According to a 2013 report by Synergy Re-search Group (www.informationweek.com/telecom/unified-communications/cisco-rules-saas-uc-conferencing -market/231601562) the market for desktop conferencing apps has been growing rapidly, spurred by a 33% jump in software-as-a-service-delivered conferencing
In their 2013 annual report, Mattel Inc. re-ported that their domestic market sales were broken down as follows: 49.6% Mattel Girls and Boys brand, 36.1% Fisher-Price brand, and the rest of their over $3.5 billion revenues were due to their American Girl brand. Create an appropriate graphical
The Wells Fargo/Gallup Small Business Index asked 604 small business owners in October 2011 “how difficult or easy do you think it will be for your company to obtain credit when you need it?” 22% said “Very difficult,” 21% “Somewhat difficult,” 28% “About Average,” 11% “Somewhat
The Wells Fargo/Gallup Small Business Index survey from Exercise 23 also asked 604 small businesses about their cash flow over the next 12 months. 13% responded “Very Good,” 37% “Somewhat good,” 21% “Neither good nor poor,” 20% “Somewhat poor,” and 7% “Very poor.” a) What do you
Data from the International Tanker Owners Pollution Federation Limited (www.itopf.com) give the cause of spillage for 455 large oil tanker accidents from 1970 to 2012. Here are the displays. Write a brief report interpreting what the displays show. Is a pie chart an appropriate display for these
In the history of the modern Olympics, the United States has won more medals than any other country. But the United States has a large population. Perhaps a better measure of success is the number of medals won per capita€”that is the number of medals divided by the population. By that
GfK Roper Reports Worldwide surveyed people, asking them €œHow important is acquiring wealth to you?€ The percent who responded that it was of more than average importance were: 71.9% China, 59.6% France, 76.1% India, 45.5% U.K., and 45.3% U.S. There were about 1500 respondents
In the same survey as that discussed in Exercise 27, GfK Roper Consulting also asked €œHow important is having control over people and resources to you?€ The percent who responded that it was of more than average importance are given in the following
Google Inc. derives revenue from three major sources: advertising revenue from their websites, advertising revenue from the thousands of third-party websites that comprise the Google Network, and licensing and miscellaneous revenue. The following table shows the percentage of all revenue derived
From the educational level data described in Exercise 1: a) Make a bar chart using counts on the y-axis. b) Make a relative frequency bar chart using percentages on the y-axis. c) Make a pie chart.
A study of a sample of 1057 houses in upstate New York reports the following percentages of houses falling into different Price and Size categories.a) Are these column, row, or total percentages? How do you know? b) What percent of the highest priced houses were small? c) From this table, can you
The following table displays information for 470 of the S&P 500 stocks, on how their one-day change on October 24, 2011 (a day on which the S&P 500 index gained 1.23%) compared with their year to date change.a) What percent of the companies reported a positive change in their stock price over the
A company started and managed by business students is selling campus calendars. The students have conducted a market survey with the various campus constituents to determine sales potential and identify which market segments should be targeted. (Should they advertise in the Alumni Magazine and/or
The Greenville, South Carolina Real Estate Hub keeps track of home sales in their area. They reported that sales were down in 2010 by about 3.7% from the previous year. Here are the number of homes sold in Greenville for the last 5 months of 2009 and 2010:a) What percent of all homes in these ten
Google Inc. divides their total costs and expenses into five categories: Costs of Revenues, Research and Development, Sales and Marketing, General and Administrative, and Dept of Justice charges (amounts in $Millions).a) What percent of total costs and expenses were sales and marketing in 2008? In
The movie ratings system is a voluntary system operated jointly by the Motion Picture Association of America (MPAA) and the National Association of Theatre Owners (NATO). The ratings themselves are given by a board of parents who are members of the Classification and Ratings Administration (CARA).
It has become more common for shoppers to €œcomparison shop€ using the Internet. Respondents to a Pew survey in 2013 who owned cell phones were asked whether they had, in the past 30 days, looked up the price of a product while they were in a store to see if they could get a
A survey of the entering MBA students at a university in the United States classified the country of origin of the students, as seen in the table.a) What percent of all MBA students were from North America? b) What percent of the Two-Year MBAs were from North America? c) What percent of the Evening
The same university as in Exercise 37 re-ported the following data on the gender of their students in their two MBA programs.a) What percent of all MBA students are women? b) What percent of Two-Year MBAs are women? c) What percent of Evening MBAs are women? d) Do you see evidence of an association
The following table shows the Motion Picture Association of America (MPA; www.mpaa.org) ratings for the top 20 grossing films in the United States for each of the 10 years from 2003 to 2012. (Data are number of films.)a) What percent of all these top 20 films are G rated? b) What percent of all top
From the age distribution data described in Exercise 2: a) Make a bar chart using counts on the y-axis. b) Make a relative frequency bar chart using percentages on the y-axis. c) Make a pie chart.
The following table shows attendance data collected by the Motion Picture Association of America during the period 2009 to 2011. Figures are the number (in millions) of frequent moviegoers in each age group.a) What percent of all frequent moviegoers during this period were people between the ages
A study by the University Of Texas Southwestern Medical Center examined 626 people to see if there was an increased risk of contracting hepatitis C associated with having a tattoo. If the subject had a tattoo, researchers asked whether it had been done in a commercial tattoo parlor or elsewhere.
In 2012, the following data were reported by the U.S. Census Bureau. The data show the number of people (in thousands) living above and below the poverty line in each of the four regions of the United States. Based on these data do you think there is an association between region and poverty?
In a random sample of U.S. adults surveyed in December 2011, Pew research asked how important it is €œto you personally€ to be successful in a high-paying career or profession. Here is a table reporting the responses. (Percentages may not add to 100% due to rounding.) (Data
The U.S. Department of Labor (www.bls.gov) collects data on the number of U.S. workers who are employed at or below the minimum wage. Here is a table showing the number of hourly workers by Age and Sex and the number who were paid at or below the prevailing minimum wage:a) What percent of the women
The Motion Picture Association of America studies the ethnicity of moviegoers to understand changes in the demographics of moviegoers over time. Here are the numbers of moviegoers (in millions) classified as to whether they were Hispanic, African-American, Caucasian, and other for the year 2010.
A department store is planning its next advertising campaign. Since different publications are read by different market segments, they would like to know if they should be targeting specific age segments. The results of a marketing survey are summarized in the following table by Age and Shopping
Look back at the table in exercise 43 concerning desires for success and a high-paying career. That table presented only the percentages, but Pew Re-search reported the numbers of respondents in the major categories:With this additional information you should be able to answer these questions.
A company that distributes a variety of pet foods is planning their next advertising campaign. Since dif-ferent publications are read by different market segments, they would like to know how pet ownership is distributed across different income segments. The U.S. Census Bureau reports the
An insurance company that provides medical insurance is concerned with recent data. They suspect that patients who undergo surgery at large hospitals have their discharges delayed for various reasons€”which results in increased medical costs to the insurance company. The recent data for
For the educational levels described in Exercise 1: a) Write two to four sentences summarizing the distribution. b) What conclusions, if any, could you make about the educational level at other companies?
A company must decide which of two delivery services they will contract with. During a recent trial period, they shipped numerous packages with each service and have kept track of how often deliveries did not arrive on time. Here are the data.a) Compare the two services€™ overall
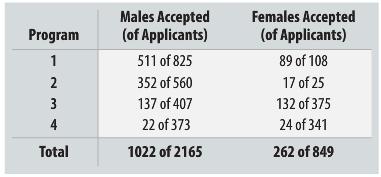
A 1975 article in the magazine Science examined the graduate admissions process at Berkeley for evidence of gender bias. The following table shows the number of applicants accepted to each of four graduate programs.a) What percent of total applicants were admitted?b) Overall, were a higher
Develop your own table of data that is a business example of Simpson’s Paradox. Explain the conflict between the conclusions made from the conditional and marginal distributions.
For the ages described in Exercise 2: a) Write two to four sentences summarizing the distribution. b) What possible problems do you see in concluding that the age distribution from these surveys accurately represents the ages of the national audience for this film?
From Exercise 1, we also have data on how long each per-son has been with the company (tenure) categorized into three levels: less than 1 year, between 1 and 5 years, and more than 5 years. A table of the two variables together looks like:a) Find the marginal distribution of the tenure. b) Verify
In addition to their age levels, the movie audiences in Exercise 2 were also asked if they had seen the movie be-fore (Never, Once, More than Once). Here is a table showing the responses by age group:a) Find the marginal distribution of their previous viewing of the movie. b) Verify that the
For the table in Exercise 7: a) Find the column percentages. b) Looking at the column percentages in part a, does the tenure distribution (how long the employee has been with the company) for each educational level look the same? Comment briefly. c) Make a sebmented or stacked bar chart showing the
In Chapter 1, you identified the W’s for the data in the file Credit Card Bank. For the categorical variables in the data set, create frequency tables, bar charts, and pie charts using your software. What might the bank want to know about these variables? Which of the tables and charts do you
As part of the marketing team at an Internet music site, you want to understand who your customers are. You send out a survey to 25 customers (you use an incentive of $50 worth of downloads to guarantee a high response rate) asking for demographic information. One of the variables is the
Adair Vineyard is a 10-acre vineyard in New Paltz, New York. The winery itself is housed in a 200-year-old historic Dutch barn, with the wine cellar on the first floor and the tasting room and gift shop on the second. Since they are relatively small and considering an expansion, they are curious
Using the ages from Exercise 1:a) Standardize the minimum and maximum ages using the mean from Exercise 5b and the standard deviation from Exercise 7d.b) Which has the more extreme z-score, the min or the max?c) How old would someone with a z-score of 3 be?
Using the purchases from Exercise 2:a) Standardize the minimum and maximum purchase using the mean from Exercise 6b and the standard deviation from Exercise 8d.b) Which has the more extreme z-score, the min or the max?c) How large a purchase would a purchase with a z-score of 3.5 be?
For the data in Exercise 1: a) Draw a boxplot using the quartiles from Exercise 7b. b) Does the boxplot nominate any outliers? c) What age would be considered a high outlier?
For the data in Exercise 2: a) Draw a boxplot using the quartiles from Exercise 8b. b) Does the boxplot nominate any outliers? c) What purchase amount would be considered a high outlier?
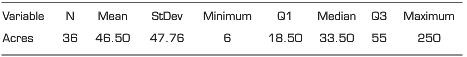
Here are summary statistics for the sizes (in acres) of upstate New York vineyards from Exercise 10.a) From the summary statistics, would you describe this distribution as symmetric or skewed? Explain.b) From the summary statistics, are there any outliers? Explain.c) Using these summary statistics,
A survey of major universities asked what percentage of incoming freshmen usually graduate €œon time€ in 4 years. Use the summary statistics given to answer these questions.a) Would you describe this distribution as symmetric or skewed? b) Are there any outliers? Explain. c)
The survey from Exercise 1 had also asked the customers to say whether they were male or female. Here are the data:Construct boxplots to compare the ages of men and women and write a sentence summarizing what you find.
The store manager from Exercise 2 has collected data on purchases from weekdays and weekends. Here are some summary statistics (rounded to the nearest dollar):Weekdays: n = 230Min = 4, Q1 = 28, Median = 40, Q3 = 68, Max = 95Weekends: n = 150Min = 10, Q1 = 35, Median = 55, Q3 = 70, Max = 100From
Here are boxplots of the weekly sales (in $ U.S.) over a two-year period for a regional food store for two locations. Location #1 is a metropolitan area that is known to be residential where shoppers walk to the store. Location #2 is a suburban area where shoppers drive to the store. Assume that
As the new manager of a small convenience store, you want to understand the shopping patterns of your customers. You randomly sample 20 purchases from yesterday€™s records (all purchases in U.S. dollars):a) Make a histogram of the data using a bar width of $20.b) Make a histogram of the data
Recall the distributions of the weekly sales for the regional stores in Exercise 19. Following are boxplots of weekly sales for this same food store chain for three stores of similar size and location for two different states: Massachusetts (MA) and Connecticut (CT). Compare the distribution of
The five-number summary for the total revenue (in $M) of the top 100 movies of 2012 looks like this:Are there any outliers in these data? How can you tell? What might your next steps in the analysis be?
The five-number summary for the ages of 100 respondents to a survey on cell phone use looks like this:Are there any outliers in these data? How can you tell? What might your next steps in the analysis be?
Are the following data time series? If not, explain why. a) Quarterly earnings of Microsoft Corp. b) Unemployment in August 2010 by education level. c) Time spent in training by workers in NewCo. d) Numbers of e-mails sent by employees of SynCo each hour in a single day.
Are the following data time series? If not, explain why. a) Reports from the Bureau of Labor Statistics on the number of U.S. adults who are employed full time in each major sector of the economy. b) The quarterly Gross Domestic Product (GDP) of France from 1980 to the present. c) The dates on
A clothing manufacturer wants to study men€™s neck sizes to plan how many shirts of different sizes to produce (shirt sizes are generally one-half inch larger than measured neck sizes and rounded to the nearest half inch). The following histogram shows the distribution of neck sizes of
For the histogram you made in Exercise 1a: a) Is the distribution unimodal or multimodal? b) Where is (are) the mode(s)? c) Is the distribution symmetric? d) Are there any outliers?
The website Los Angeles GasPrices.com has current gasoline prices all over the United States. In the week of February 5, 2013, the following histogram shows the gas prices at 55 stations in the San Francisco Bay Area. Describe the shape of this distribution (shape, center, spread, unusual
In 2013, the Standard & Poor€™s (S&P) 500 stock index reached a new all time high in early April. For the first quarter of 2013, the index was up 10.0%. Here is a histogram of the returns for Money Magazine€™s top 70 mutual funds for the same period.Year to Date Return (in
A researcher, interested in studying gender differences in negotiations, collects data on the prices that men and women pay for new cars. Here is a histogram of the discounts (the amount in $ below the list price) that men and women received at one car dealership for the last 100 transactions (54
Use the actual data set of Exercise 31 to answer the following questions. a) Find the five-number summary for these data. b) Find appropriate measures of center and spread for these data. c) Create a boxplot for these data. d) What can you see, if anything, in the histogram that isn’t clear in
Use the data set of Exercise 32 to answer the following questions. a) Find the five-number summary for these data. b) Create a boxplot for these data. c) What can you see, if anything, in the histogram of Exercise 32 that isn’t clear in the boxplot?
The data set provided contains the data from Exercises 10 and 15. Create a stem-and-leaf display of the sizes of the vineyards in acres. Point out any unusual features of the data that you can see from the stem-and-leaf.
The data set provided contains the data from Exercise 30 on the price of gas for 55 stations around San Francisco in January 2013. Create a stem-and-leaf display of the data. Point out any unusual features of the data that you can see from the stem-and-leaf.
During his 20 seasons in the National Hockey League, Wayne Gretzky scored 50% more points than anyone else who ever played professional hockey. He accomplished this amazing feat while playing in 280 fewer games than Gordie Howe, the previous record holder. Here are the number of games Gretzky
In his 16-year career as a player in major league baseball, Mark McGwire hit 583 home runs, placing him eighth on the all-time home run list (as of 2008). Here are the number of home runs that McGwire hit for each year from 1986 through 2001: 3, 49, 32, 33, 39, 22, 42, 9, 9, 39, 52, 58, 70, 65, 32,
Look once more at data of hockey games played each season by Wayne Gretzky, seen in Exercise 37.a) Would you use the mean or the median to summarize the center of this distribution? Why?b) Without actually finding the mean, would you expect it to be lower or higher than the median? Explain.c) A
For the histogram you made in Exercise 2a: a) Is the distribution unimodal or multimodal? b) Where is (are) the mode(s)? c) Is the distribution symmetric? d) Are there any outliers?
Look once more at data of home runs hit by Mark McGwire during his 16-year career as seen in Exercise 38.a) Would you use the mean or the median to summarize the center of this distribution? Why?b) Find the median.c) Without actually finding the mean, would you expect it to be lower or higher than
The weekly prices of one brand of frozen pizza over a three-year period in Dallas are provided in the data file. Use the price data to answer the following questions. a) Find the five-number summary for these data. b) Find the range and IQR for these data. c) Create a boxplot for these data. d)
The weekly prices of one brand of frozen pizza over a three-year period in Chicago are provided in the data file. Use the price data to answer the following questions. a) Find the five-number summary for these data. b) Find the range and IQR for these data. c) Create a boxplot for these data. d)
The U.S. Energy Information Administration (EIA) collects data on the total energy consumption by sector for each state and the District of Columbia. The following data show the per capita consumption in the year 2011 used for transportation (converted to gallons of gasoline per person). Write a
Established in Paris in 1961, the organisation for Economic Cooperation and Development (OECD) (www.oecd.org) collects information on many economic and social aspects of countries around the world.Here are the 2011 GDP growth rates (in percentages) of 35 industrialized countries. Write a brief
A start-up company is planning to build a new golf course. For marketing purposes, the company would like to be able to advertise the new course as one of the more difficult courses in the state of Vermont. One measure of the difficulty of a golf course is its length: the total distance (in yards)
A real estate agent has surveyed houses in 20 nearby ZIP codes in an attempt to put together a comparison for a new property that she would like to put on the market. She knows that the size of the living area of a house is a strong factor in the price, and she€™d like to market this
Sales (in $) for one week were collected for 18 stores in a food store chain in the northeastern United States. The stores and the towns they are located in vary in size.a) Make a suitable display of the sales from the data provided.b) Summarize the central value for sales for this week with a
Insurance companies don’t know whether a policy they’ve written is profitable until the policy matures (expires). To see how they’ve performed recently, an analyst looked at mature policies and investigated the net profit to the company (in $). a) Make a suitable display of the profits from
In the early days of the iPod, MacInTouch (www.macintouch.com/reliability/ipod failures.html) surveyed readers about reliability. Of the 8926 iPods owned at that time, 7510 were problem-free while the other 1416 failed. From the data on the CD, compute the failure rate for each of the 17 iPod
For the data in Exercise 1: a) Would you expect the mean age to be smaller than, bigger than, or about the same size as the median? Explain. b) Find the mean age. c) Find the median age.
The data set provided contains 2012 (2nd quarter) unemployment rates for 34 developed countries (www.oecd.org). Produce an appropriate graphical display and briefly describe the distribution of unemployment rates. Report and comment on any outliers you may see.
A driver has recorded and posted on the Internet (www.randomuseless.info/gasprice/gasprice.html) the price he paid for gasoline at every purchase from 1979 to 2012. Since 1984 all purchases were self-serve and all were for premium (92-93Octane) gas. He has also standardized the prices to April 1979
American automobile companies are becoming more motivated to improve the fuel efficiency of the automobiles they produce. It is well known that fuel efficiency is impacted by many characteristics of the car. Describe what these boxplots tell you about the relation-ship between the number of
The boxplots display bottle prices (in dollars) of dry Riesling wines produced by vineyards along three of the Finger Lakes in upstate New York.a) Which lake region produced the most expensive wine? b) Which lake region produced the cheapest wine? c) In which region were the wines generally more
Historic ozone levels (in parts per billion, ppb) were recorded at sites in New Jersey monthly. Here are boxplots of the data for each month (over 46 years) lined up in order (January = 1).a) In what month was the highest ozone level ever recorded? b) Which month has the largest IQR? c) Which month
How fast do horses run? Kentucky Derby winners top 30 mph, as shown in the graph. This graph shows the percentage of Kentucky Derby winners that have run slower than a given speed. Note that few have won running less than 33 mph, but about 95% of the winning horses have run less than 37 mph. (A
Here is an ogive of the distribution of monthly returns for a group of aggressive (or high growth) mutual funds over a period of 25 years. (Recall from Exercise 55 that an ogive, or cumulative relative frequency graph, shows the percent of cases at or below a certain value. Thus this graph always
Three Statistics classes all took the same test. Here are histograms of the scores for each class.a) Which class had the highest mean score? b) Which class had the highest median score? c) For which class are the mean and median most different? Which is higher? Why? d) Which class had the smallest
Showing 14000 - 14100
of 88243
First
134
135
136
137
138
139
140
141
142
143
144
145
146
147
148
Last
Step by Step Answers
.png)
.png)
.png)
.png)
.png)
.png)
.png)
.png)
.png)
.png)
.png)
.png)
.png)
.png)
.png)
.png)
.png)
.png)
.png)
.png)
.png)
.png)
.png)
.png)
.png)
.png)
.png)
.png)
.png)
.png)
.png)
.png)
.png)
.png)
.png)
.png)
.png)
.png)
.png)
.png)
.png)
.png)
.png)
.png)
.png)
.png)
.png)
.png)
.png)
.png)
.png)
.png)
.png)
.png)
.png)
.png)
.png)
.png)
.png)

