New Semester
Started
Get
50% OFF
Study Help!
--h --m --s
Claim Now
Question Answers
Textbooks
Find textbooks, questions and answers
Oops, something went wrong!
Change your search query and then try again
S
Books
FREE
Study Help
Expert Questions
Accounting
General Management
Mathematics
Finance
Organizational Behaviour
Law
Physics
Operating System
Management Leadership
Sociology
Programming
Marketing
Database
Computer Network
Economics
Textbooks Solutions
Accounting
Managerial Accounting
Management Leadership
Cost Accounting
Statistics
Business Law
Corporate Finance
Finance
Economics
Auditing
Tutors
Online Tutors
Find a Tutor
Hire a Tutor
Become a Tutor
AI Tutor
AI Study Planner
NEW
Sell Books
Search
Search
Sign In
Register
study help
mathematics
statistics
Complete Business Statistics 7th Edition Amir Aczel, Jayavel Sounderpandian - Solutions
Regress Y against X with the following data from a random sample of 15 observations:X Y12 ..............1004 ............... 6010 .............. 9615 ..............1026 ............... 684 ............... 7013 ..............10211 .............. 9210 .............. 9518 ..............12520
Explain the advantages of the least-squares procedure for fitting lines to data. Explain how the procedure works.
1. Write the estimated regression equation predicting leverage (L) based on shareholder rights (R). 2. Carry out a statistical test for the existence of a linear relationship between the two variables. 3. The reported r2 value was 16.50%. Comment on the predictive power of the regression equation
1. Carry out the regression and find the β for the stock. What is the regression equation?2. Does the value of the slope indicate that the stock has above-average risk? (For the purposes of this case assume that the risk is average if the slope is in the range 1 ± 0.1, below average if it is less
What are the assumptions underlying the multiple regression model? What is the purpose of the assumption of normality of the errors?
Explain what is tested by the hypothesis test in equation. What conclusion should be reached if the null hypothesis is not rejected? What conclusion should be reached if the null hypothesis is rejected? H0: β1 = β2 = β3 = . . . . = βk = 0 H1: Not all the βi (i = 1, . . . , k) are zero
Find the value of the Durbin-Watson statistic for the model of Example 11-3, and conduct the Durbin-Watson test. Is the assumption of no first-order error autocorrelation satisfied? Explain.
State the conditions under which a one-sided Durbin-Watson test is appropriate (i.e., a test for positive autocorrelation only, or a test for a negative autocorrelation only).
For the regression you performed in problem 11-39, produce and interpret the Durbin-Watson statistic.
Use a stepwise regression program to find the best set of variables for Example 11-1.
Discuss the relative merits and limitations of the four variable selection methods described in this section.
Discuss the relative merits and limitations of the four variable selection methods described in this section. Discuss.
A multiple regression of price versus the independent variables quality, industry, category, and quality X industry and quality X category was carried out. The R2 was 67.5%. The t statistic for each variable alone was significant, but the cross products were not. Explain.
An article in Psychology and Marketing describes four variables that have been found to impact the effectiveness of commercials for high-performance automobiles: sincerity, excitement, ruggedness, and sophistication. Suppose that the following data are available on commercials' effectiveness and
The following data are the asking price and other variables for condominiums in a small town. Try to construct a prediction equation for the asking price based on any of or all the other reported variables.
A study was reported about the effects of the number of hours worked, on average, and the average hourly income on unemployment in different countries.3 Suppose that the regression analysis resulted in SSE = 8,650, SSR = 988, and the sample size was 82 observations. Is there a regression
Avis is interested in estimating weekly costs of maintenance of its rental cars of a certain size based on these variables: number of miles driven during the week, number of renters during the week, the car's total mileage, and the car's age. A regression analysis is carried out, and the results
Nissan Motor Company wanted to find leverage factors for marketing the Maxima model in the United States. The company hired a market research firm in New York City to carry out an analysis of the factors that make people favor the model in question. As part of the analysis, the market research firm
Prove equation.
Can you judge how well a regression model fits the data by considering the mean square error only? Explain.
A regression analysis was carried out of the stock return on the first day of an IPO (initial public offering) based on four variables: assessed benefit of the IPO, assessed improved market perception, assessed perception of market strength at the time of the IPO, and assessed growth potential due
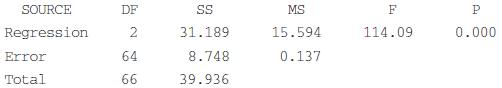
A portion of the regression output for the Nissan Motor Company study of problem 11-14 follows. Interpret the findings, and show how these results are obtainable from the ANOVA table results presented in problem 11-14. How good is the regression relationship between the overall appeal score for the
A study of the market for mortgage-backed securities included a regression analysis of security effects and time effects on market prices as dependent variable.The sample size was 383 and the R2 was 94%. How good is this regression? Would you confidently predict market price based on security and
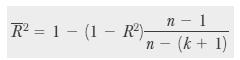
In the Nissan Motor Company situation in problem 11-21, suppose that a new variable is considered for inclusion in the equation and a new regression relationship is analyzed with the new variable included. Suppose that the resulting multiple coefficient of determination is R2 = 91.8%. Find the
An article on pricing and competition in marketing reports the results of a regression analysis. Information price was the dependent variable, and the independent variables were six marketing measures. The R2 was 76.9%. Interpret the strength of this regression relationship. The number of data
The following excerpt reports the results of a regression of excess stock returns on firm size and stock price, both variables being ranked on some scale. Explain, critique, and evaluate the reported results.
A study of Dutch tourism behavior included a regression analysis using a sample of 713 respondents. The dependent variable, number of miles traveled on vacation, was regressed on the independent variables, family size and family income; and the multiple coefficient of determination was R2 = 0.72.
A regression analysis was carried out to assess sale prices of land in Uganda based on many variables that describe the owner of the land: age, educational level, number of males in the household, and more.7 Suppose that there are eight independent variables, 500 data points, SSE = 6,179, and SST =
A regression analysis is carried out, and a confidence interval for β1 is computed to be [1.25, 1.55]; a confidence interval for β2 is [2.01, 2.12]. Both are 95% confidence intervals. Explain the possibility that the point (1.26, 2.02) may not lie inside a joint confidence region for (β1, β2)
A multiple regression model was developed for predicting firms' governance level, measured on a scale, based on firm size, firm profitability, fixed-asset ratio, growth opportunities, and non-debt tax shield size. For firm size, the coefficient estimate was 0.06 and the standard error was 0.005.
In terms of model assumptions, what is the difference between a multiple regression model with k independent variables and a correlation analysis involving these variables?
Give three reasons why caution must be exercised in interpreting the significance of single regression slope parameters.
Give 95% confidence intervals for the slope parameters β2 through β5, using the information in Table. Which confidence intervals contain the point (0, 0)? Explain the interpretation of such outcomes.
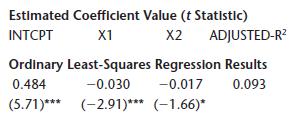
A regression analysis was carried out to predict a firm's reputation (defined on a scale called the Carter-Manaster reputation ranking) on the basis of unexpected accruals, auditor quality, return on investment, and expenditure on research and development. The parameter estimates (and standard
A computer program for regression analysis produces a joint confidence region for the two slope parameters considered in the regression equation, β1 and β2. The elliptical region of confidence level 95% does not contain the point (0, 0). Not knowing the value of the F statistic, or R2, do you
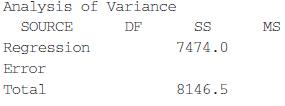
After the model of problem 11-35, the next model was run:The regression equation isAnalysis of Variancea. What happened when Price was dropped from the regression equation? Why?b. Compare this model with all previous models of exports versus the economic variables, and draw conclusions.c. Which
A study of 14,537 French firms was carried out to assess employment growth based on levels of new technological process, organizational innovation, commercial innovation, and research and development. The R2 was 74.3%. The coefficient estimates for these variables (and standard errors) were
Run a regression of profits against revenues and number of employees for the airline industry using the data in the following table. Interpret all your findings.
What is a response surface? For a regression model with seven independent variables, what is the dimensionality of the response surface?
What is an influential observation? Give a few examples.
Using the regression relationship you estimated in problem 11–8, predict the value of a home 1,800 square feet located 2.0 miles from the center of the town.
Using the regression equation from problem 11-25, predict excess stock return when SIZRNK = 5 and PRCRNK = 6.
Using the information in Table, what is the standard error of Y-hat? What is the standard error of E(Y-hat)?
Use a computer to produce a prediction interval and a confidence interval for the conditional mean of Y for the prediction in problem 11-50. Use the data in Table.
Why is the prediction interval of 95% wider than the 95% confidence interval for the conditional mean, using the same values of the independent variables?
Echlin, Inc., makes parts for automobiles. The company is engaged in strong competition with Japanese, Taiwanese, and Korean manufacturers of the same automobile parts. Recently, the company hired a statistician to study the relationship between monthly sales and the independent variable, number of
A regression analysis was carried out based on 7,016 observations of firms, aimed at assessing the factors that determine the level of a firm's leverage. The independent variables included amount of fixed assets, profitability, firm size, volatility, and abnormal earnings level, as well as a dummy
Use the data in Table 11-6 to run a polynomial regression model of exports to Singapore versus M1 and M1 squared, as well as Price and Price squared, and an interaction term. Also try to add a squared exchange rate variable into the model. Find the best, most parsimonious regression model for the
Use the data of Example 11-3, presented in Table, to try to fit a polynomial regression model of movie gross earnings on production cost and production cost squared. Also try promotion and promotion squared. What is the best, most parsimonious model?
An ingenious regression analysis was reported in which the effects of the 1985 French banking deregulation were assessed. Bank equity was the dependent variable, and each data point was a tax return for a particular quarter and bank in France from 1978 to the time the research was done. This
For a multiple regression model with two independent variables, results of the analysis include ∑y = 852, ∑x1 = 155, ∑x2 = 88, ∑x1y = 11,423, ∑x2y = 8,320, ∑x1x2 = 1,055, ∑x21 = 2,125, and ∑x22 = 768, n = 100. Solve the normal equations for this regression model, and give the
The model used in economics to describe production isQ = β0Cβ1 K β2 L β3 εWhere the dependent variable Q is the quantity produced, C is the capacity of a production unit, K is the capital invested in the project, and L is labor input, in days. Transform the model to linear regression
A realtor is interested in assessing the impact of size (in square feet) and distance from the center of town (in miles) on the value of homes (in thousands of dollars) in a certain area. Nine randomly chosen houses are selected; data are as follows.Y (value): 345, 238, 452, 422, 328, 375, 660,
Regress Y against X1, X2, and X3 with the following sample data:a. What is the regression equation?b. Change the first observation of X3 from 8.00 to 9.00. Repeat the regression.What is the new regression equation?c. Compare the old and the new regression equations. Does the comparison prove
Explain what is meant by perfect collinearity. What happens when perfect collinearity is present?
The estimated regression coefficients in Example 11-1 are b0 = 47.165, b1 = 1.599, and b2 = 1.149 (rounded to three decimal places). Explain the meaning of each of the three numbers in terms of the situation presented in the example.
State three limitations of the Durbin-Watson test.
Find the value of the Durbin-Watson statistic for the data of Example 11-5, and conduct the Durbin-Watson test. State your conclusion.
Find the value of the Durbin-Watson statistic for the model of Example 11-3, and conduct the Durbin-Watson test. Is the assumption of no first-order error autocorrelation satisfied? Explain.
The table that follows presents financial data of some companies drawn from four different industry sectors. The data include return on capital, sales, operating margin, and debt-to-capital ratio all pertaining to the same latest 12 months for which data were available for that company. The period
What are the advantages and disadvantages of trend analysis? When would you use this method of forecasting?
The following data are the monthly profit margins, in dollars per gallon, for an ethanol marketer from January 2005 through December 2006.0.5, 0.7, 0.8, 1.0, 1.0, 0.9, 1.1, 1.4, 1.5, 1.4, 0.7, 0.8, 0.8, 0.7, 1.1, 1.5, 1.7, 1.5, 1.6, 1.9, 2.1, 2.4, 2.6, 1.4Construct a forecasting model for these
The following data are monthly figures of factory production, in millions of units, from July 2004 through April 2007:7.4, 6.8, 6.4, 6.6, 6.5, 6.0, 7.0, 6.7, 8.2, 7.8, 7.7, 7.3, 7.0, 7.1, 6.9, 7.3, 7.0, 6.7, 7.6, 7.2, 7.9, 7.7,7.6, 6.7, 6.3, 5.7, 5.6, 6.1, 5.8, 5.9, 6.2, 6.0, 7.3, 7.4Decompose the
The following data are monthly price discovery contributions for gold prices from the COMEX open outcry contract for November 2004 through August 2006.0.38, 0.38, 0.44, 0.42, 0.44, 0.46, 0.48, 0.49, 0.51, 0.52, 0.45, 0.40, 0.39, 0.37, 0.38, 0.37,0.33, 0.33, 0.32, 0.32, 0.32, 0.31Construct a
An article in Harvard Business Review looked at the percentage of negative media stories about British Petroleum (BP) in 2005 and 2006. The monthly data, in percent, from January 2005 through September 2006, are as follows.14, 10, 50, 24, 16, 15, 20, 42, 18, 26, 21, 20, 18, 10, 22, 24, 26, 24, 18,
The following are quarterly data, in millions of dollars, of corporate revenues for a firm in the apparel industry from first quarter 2005 through first quarter 2007:3.4, 4.5, 4.0, 5.0, 4.2, 5.4, 4.9, 5.7, 4.6Predict corporate revenue for the second quarter of 2004.
The following data are Vodafone’s quarterly market share of revenue (in percent) for 1992 through 2003 in Portugal.28, 39, 41, 43, 46, 48, 53, 55, 59, 60, 61, 60, 58, 59, 60, 60, 57, 55, 56, 52, 49, 52, 52, 53, 46, 45, 42, 40, 39, 40, 39, 38, 35, 37, 36, 33, 30, 32, 33, 32, 27, 28, 28, 26, 27,
The following are weekly sales data, in thousands of units, for microcomputer disks:57, 58, 60, 54, 56, 53, 55, 59, 62, 57, 50, 48, 52, 55, 58, 61Use w = 0.3 and w = 0.8 to produce an exponential smoothing model for these data.Which value of w produces better forecasts? Explain.
Construct an exponential smoothing forecasting model, using w = 0.7, for new orders reported by a manufacturer. Monthly data (in thousands of dollars) to April 2007 are195, 193, 190, 185, 180, 190, 185, 186, 184, 185, 198, 199, 200, 201, 199, 187, 186, 191, 195, 200, 200, 190, 186, 196, 198, 200,
The following data are from the Treasury Bulletin, published by the U.S. Department of the Treasury. They represent total U.S. liabilities to foreigners for the years 2000 to 2006 in millions of dollars:Can you forecast total U.S. liabilities to foreigners for 2007?
An article in Real Estate Finance displays the following data for Brazil€™s short-term interest rates (in percent).Develop a good forecasting model, and use it to forecast Brazil€™s short-term rate forJuly 2007.
Prove that equation 12€“10 is equivalent to equation 12€“11.
Prove the equivalence of equations 12€“11 and 12€“12.
In 1987, the base year was changed to [1982 = 100]. Change the base for all the figures in Table.
What are the uses of index numbers?
The following is Nigeria’s Industrial Output Index for the years 1984 to 1997:Year ......Index of Output1984 ......1751985 ......1901986 ......1321987 ...... 961988 ......1001989 ...... 781990 ......1311991 ......1351992 ......1541993 ......1631994 ......1781995 ......1701996 ......1451997
The following data are monthly existing-home sales, in millions of dwelling units, for January 2006 through June 2007. Construct a forecasting model for these data, and use it in forecasting sales for July 2007.4.4, 4.2, 3.8, 4.1, 4.1, 4.0, 4.0, 3.9, 3.9, 3.8, 3.7, 3.7, 3.8, 3.9, 3.8, 3.7, 3.5, 3.4
The following data are a local newspaper€™s readership figures, in thousands:Do a trend regression on the data, and forecast the total number of readers for 2008 and for 2009.
Discuss and compare all the forecasting methods presented in this chapter. What are the relative strengths and weaknesses of each method? Under what conditions would you use any of the methods?
Discuss the main principle of the exponential smoothing method of forecasting. What effect does the smoothing constant w have on the forecasts?
The following data represent the performance of a constant-proportion debt obligation (CPDO), executed on October 10, 2006, from that day until March 10, 2007, recorded biweekly: 99, 102, 102, 101, 103, 103, 104, 103, 104, 106, 101, 102. Construct a forecasting model for these data and predict the
The following data are annual time series measurements of market segmentation in Thailand for 1991 and onward.18, 17, 15, 14, 15, 11, 8, 5, 4, 3, 5, 4, 6, 5, 7, 8Construct a forecasting model for these data and predict market segmentation in Thailand for the following year, 2007.
Open the Trend+Season Forecasting template shown in Figure, used for monthly data and do a sensitivity analysis on this template. Change some of the values in the table and see how the forecasts change. Are there large relative changes?
The following data are annual percentage changes in GDP for a small country from 2001 to 2007:6.3, 6.6, 7.3, 7.4, 7.8, 6.9, 7.8Do trend-line forecasting.
The following data are the share of foreign shareholding as a percentage of total market capitalization in Korea for the past 12 years: 5, 10, 10, 12, 13, 14, 18, 21, 30, 37, 37, 40. Develop a forecasting model for these data and forecast foreign shareholding percentage for Korea in the following
The quarterly sales of a large manufacturer of spare parts for automobiles are tabulated below. Since the sales are in millions of dollars, forecast errors can be costly. The company wants to forecast the sales as accurately as possible.1. Carry out a Trend+Season forecast with the sales data, and
The capacity of the fuel tank of the 2007 Volvo S40 is designed to be 12.625 gallons. The actual capacity of tanks produced is controlled using a control chart. The data of 9 random samples of size 5 each collected on 9 different days are tabulated below. Draw X-bar, R, and s charts. Is the process
The amount of mineral water filled in 2-liter bottles by an automatic bottling machine is monitored using a control chart. The actual contents of random samples of 4 bottles collected on 8 different days are tabulated below. Draw X-bar, R, and s charts. Is the process in control? If it is not,
A battery manufacturer looks at samples of 30 batteries at the end of every day of production and notes the number of defective batteries. Results are 1, 1, 0, 0, 1, 2, 0, 1, 0, 0, 2, 5, 0, 1. Is the production process under control?
BASF Inc. makes CDs for use in computers. A quality control engineer at the plant tests batches of 50 disks at a time and plots the proportions of defective disks on a control chart. The first 10 batches used to create the chart had the following numbers of defective disks: 8, 7, 6, 7, 8, 4, 3, 5,
The following are the numbers of imperfections per yard of yarn produced in a mill in Pennsylvania in May 2007: 5, 3, 4, 8, 2, 3, 1, 2, 5, 9, 2, 2, 2, 3, 4, 2, 1. Is there evidence that the process is out of control?
The following are the numbers of imperfections in rolls of wallpaper made by Laura Ashley: 5, 6, 3, 4, 5, 2, 7, 4, 5, 3, 5, 5, 3, 2, 0, 5, 5, 6, 7, 6, 9, 3, 3, 4, 2, 6. Construct a c chart for the process, and determine whether there is evidence that the process is out of control.
Weights of pieces of tile made in Arizona in April 2007 (in ounces) are as follows: 2.5, 2.66, 2.8, 2.3, 2.5, 2.33, 2.41, 2.88, 2.54, 2.11, 2.26, 2.3, 2.41, 2.44, 2.17, 2.52, 2.55, 2.38, 2.89, 2.9, 2.11, 2.12, 2.13, 2.16. Create an R chart for these data, using subgroups of size 4. Is the process
Use the data to create an x̄ chart to test whether the process mean is under control.2.5, 2.66, 2.8, 2.3, 2.5, 2.33, 2.41, 2.88, 2.54, 2.11, 2.26, 2.3, 2.41, 2.44, 2.17,2.52, 2.55, 2.38, 2.89, 2.9, 2.11, 2.12, 2.13, 2.16
What is a quality control chart, and how is it used?
Create an s chart for the data. 2.5, 2.66, 2.8, 2.3, 2.5, 2.33, 2.41, 2.88, 2.54, 2.11, 2.26, 2.3, 2.41, 2.44, 2.17, 2.52, 2.55, 2.38, 2.89, 2.9, 2.11, 2.12, 2.13, 2.16
The weight of a connecting rod used in a diesel engine made at a plant of the General Motors Corporation needs to be strictly uniform to minimize vibrations in the engine. The connecting rod is produced by a forging process. Every day, five rods coming out of the process are selected at random and
What are the components of a quality control chart?
What is acceptance sampling?
Describe how one would use experimental design in an effort to improve industrial quality.
Showing 17300 - 17400
of 88243
First
167
168
169
170
171
172
173
174
175
176
177
178
179
180
181
Last
Step by Step Answers
.png)
.png)
.png)
.png)
.png)


.png)
-1.png)
.png)
.png)
.png)
.png)
.png)
.png)
.png)
.png)
.png)
.png)
.png)
.png)
-1.png)
-2.png)
-3.png)
.png)
.png)
.png)

