New Semester
Started
Get
50% OFF
Study Help!
--h --m --s
Claim Now
Question Answers
Textbooks
Find textbooks, questions and answers
Oops, something went wrong!
Change your search query and then try again
S
Books
FREE
Study Help
Expert Questions
Accounting
General Management
Mathematics
Finance
Organizational Behaviour
Law
Physics
Operating System
Management Leadership
Sociology
Programming
Marketing
Database
Computer Network
Economics
Textbooks Solutions
Accounting
Managerial Accounting
Management Leadership
Cost Accounting
Statistics
Business Law
Corporate Finance
Finance
Economics
Auditing
Tutors
Online Tutors
Find a Tutor
Hire a Tutor
Become a Tutor
AI Tutor
AI Study Planner
NEW
Sell Books
Search
Search
Sign In
Register
study help
mathematics
statistics
Complete Business Statistics 7th Edition Amir Aczel, Jayavel Sounderpandian - Solutions
1. Test the null hypothesis at α = 0.05. 2. Later it was found that quite a few tires failed on the road. As a part of the investigation, the above hypothesis test is reviewed. Considering the high cost of type II error, the value of 5% for α is questioned. The response was that the cost of
Four populations are compared by analysis of variance. What are the possible relations among the four population means covered under the null and alternative hypotheses?
What is the main principle behind analysis of variance?
Explain how information about the variance components in a data set can lead to conclusions about population means.
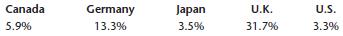
An article in Advertising Age discusses the need for corporate transparency of all transactions and hails the imperative "Get naked," which, it said, appeared on the cover of a recent issue of Wired. The article tried to compare the transparency policies of Microsoft, Google, Apple, and Wal-Mart.
By the sum-of-squares principle, SSE and SSTR are additive, and their sum is SST. Does such a relation exist between MSE and MSTR? Explain.
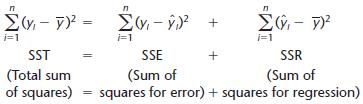
Prove the sum-of-squares principle, equation 9-12.
Gulfstream Aerospace Company produced three different prototypes as candidates for mass production as the company's newest large-cabin business jet, the Gulfstream IV. Each of the three prototypes has slightly different features, which may bring about differences in performance. Therefore, as part
In the theory of finance, a market for any asset or commodity is said to be efficient if items of identical quality and other attributes (such as risk, in the case of stocks) are sold at the same price. A Geneva-based oil industry analyst wants to test the hypothesis that the spot market for crude
Research has shown that in the fast-paced world of electronics, the key factor that separates the winners from the losers is actually how slow a firm is in making decisions: The most successful firms take longer to arrive at strategic decisions on product development, adopting new technologies, or
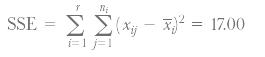
Give 95% confidence intervals for the remaining four population mean responses to the Club Med resorts (the one for Guadeloupe having been given in the text).
Use the data of Table 9€“1 and the Tukey procedure to determine where differences exist among the triangle, circle, and square population means. Use α = 0.01.In table
For problem 9€“18, find which, if any, of the three prototype planes has an average range different from the others. Use α = 0.05.In problem Gulfstream Aerospace Company produced three different prototypes as candidates for mass production as the company's newest large-cabin business jet,
For problem 9€“19, use the Tukey method to determine which oil types, if any, have an average price different from the others. Use α = 0.05.In problem In the theory of finance, a market for any asset or commodity is said to be efficient if items of identical quality and other attributes
Researchers in retail studies wanted to find out how children and adults react to companies’ pricing tactics. They looked at a random sample of 44 10th-grade students, a random sample of pretested adults consisting of 42 people, and a third sample of 71 adults. For each person, they evaluated the
A study was carried out to find out whether prices differed, on average, within three possible market conditions: monopoly, limited competition, and strong competition. The results were reported as F(2, 272) = 44.8. Further analysis reported that for the difference between monopoly and limited
For problem 9–18, suppose that four more prototype planes are built after the study is completed. Could the inference from the ANOVA involving the first three prototypes be extended to the new planes? Explain.
What are the limitations of two-way ANOVA? What problems may be encountered?
In an analysis of variance comparing the output of five plants, data sets of 21 observations per plant are analyzed. The computed F statistic value is 3.6. Do you believe that there are differences in average output among the five plants? What is the approximate p-value? Explain.
The following table reports salaries, in thousands of dollars per year, for executives in three job types and three locations. Conduct a two-way ANOVA on these data.
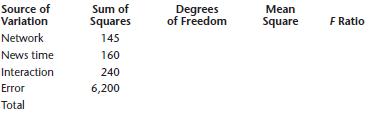
The Neilsen Company, which issues television popularity rating reports, is interested in testing for differences in average viewer satisfaction with morning news, evening news, and late news. The company is also interested in determining whether differences exist in average viewer satisfaction with
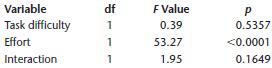
An article reports the results of an analysis of salespersons€™ performance level as a function of two factors: task difficulty and effort. Included in the article is the following ANOVA table:a. How many levels of task difficulty were studied?b. How many levels of effort were studied?c. Are
A study evaluated the results of a two-way ANOVA on the effects of the two factors€”exercise price of an option and the time of expiration of an option€”on implied interest rates (the measured variable). Included in the article is the following ANOVA table.a. What is meant by Explained in
A real estate development firm wants to test whether there are differences in the average price of a lot of a given size in the center of each of four cities: Philadelphia, New York, Washington, and Baltimore. Random samples of 52 lots in Philadelphia, 38 lots in New York, 43 lots in Washington,
How would you design a block ANOVA for the two-way analysis of the situation described in problem 9–42? Which ANOVA method is appropriate for the analysis?
Public concern has recently focused on the fact that although people in the United States often try to lose weight, statistics show that the general population has gained weight, on average, during the last 10 years. A researcher hired by a weight loss organization is interested in determining
IBM Corporation has been retraining many of its employees to assume marketing positions. As part of this effort, the company wanted to test four possible methods of training marketing personnel to determine if at least one of the methods was better than the others. Four groups of 70 employees each
An enterprising art historian recently started a new business: the production of walking-tour audiotapes for use by those visiting major cities. She originally produced tapes for eight cities: Paris, Rome, London, Florence, Jerusalem, Washington, New York, and New Haven. A test was carried out to
NAMELAB is a San Francisco-based company that uses linguistic analysis and computers to invent catchy names for new products. The company is credited with the invention of Acura, Compaq, Sentra, and other names of successful products. Naturally, statistical analysis plays an important role in
As software for microcomputers becomes more and more sophisticated, the element of time becomes more crucial. Consequently, manufacturers of software packages need to work on reducing the time required for running application programs. Speed of execution also depends on the computer used. A two-way
Define treatment and error.
An ANOVA assessing the effects of three blocks of respect and three levels of altruism was carried out. The F-statistic value was 13.65 and the degrees of freedom were 74 for blocks, 2 for treatment, and 224 for total. What was the total sample size? Are the results of the ANOVA significant?
Young affluent U.S. professionals are creating a growing demand for exotic pets. The most popular pets are the Shiba Inu dog breed, Rottweilers, Persian cats, and Maine coons. Prices for these pets vary and depend on supply and demand. A breeder of exotic pets wants to know whether these four pets
Analysis of variance has long been used in providing evidence of the effectiveness of pharmaceutical drugs. Such evidence is required before the Food and Drug Administration (FDA) will allow a drug to be marketed. In a recent test of the effectiveness of a new sleeping pill, three groups of 25
A more efficient experiment than the one described in problem 9-62 was carried out to determine whether a sleeping pill was effective. Each person in a random sample of 30 people was given the three treatments: drug, placebo, nothing. The order in which these treatments were administered was
Three new high-definition television models are compared. The distances (in miles) over which a clear signal is received in random trials for each of the models are given below.Carry out a complete analysis of variance, and report your results in the form of a memorandum. State your hypotheses and
A professor of food chemistry at the University of Wisconsin recently developed a new system for keeping frozen foods crisp and fresh: coating them with watertight, edible film. The Pillsbury Company wants to test whether the new product is tasty. The company collects a random sample of consumers
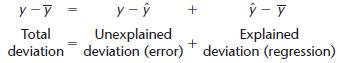
Explain how the total deviation is partitioned into the treatment deviation and the error deviation.
Explain the sum-of-squares principle.
Let us continue discussing the ideas about studying wines using analysis of variance begun in the introduction to this chapter. The four important wine grapes in the introduction are to be compared using ANOVA to see whether experts rate random samples of wines in these groups similarly, on
Three checkout lines at a supermarket use three different scanner systems that read the UPC symbols on products and find the prices. The store manager suspects that the three scanner systems have different efficiencies and wants to check their speeds. He measures at randomly selected times the
Can you think of a possible limitation of the least-squares procedure?
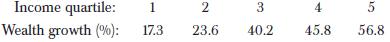
An article in the Journal of Monetary Economics assesses the relationship between percentage growth in wealth over a decade and a half of savings for baby boomers of age 40 to 55 with these people's income quartiles. The article presents a table showing five income quartiles, and for each quartile
Recently, research efforts have focused on the problem of predicting a manufacturer’s market share by using information on the quality of its product. Suppose that the following data are available on market share, in percentage (Y), and product quality, on a scale of 0 to 100, determined by an
A pharmaceutical manufacturer wants to determine the concentration of a key component of cough medicine that may be used without the drug’s causing adverse side effects. As part of the analysis, a random sample of 45 patients is administered doses of varying concentration (X), and the severity of
The following are data on annual inflation and stock returns. Run a regression analysis of the data and determine whether there is a linear relationship between inflation and total return on stocks for the periods under study.Inflation (%) Total Return on Stocks (%)1 ................–32
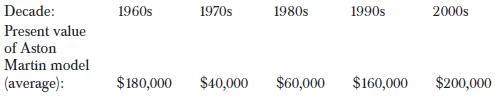
An article in Worth discusses the immense success of one of the world’s most prestigious cars, the Aston Martin Vanquish. This car is expected to keep its value as it ages. Although this model is new, the article reports resale values of earlier Aston Martin models over various decades.Based on
For the data given below, regress one variable on the other. Is there an implication of causality, or are both variables affected by a third?
Derive the normal equations (10€“8) by taking the partial derivatives of SSE with respect to b0 and b1 and setting them to zero.
Give a 99% confidence interval for the slope parameter in Example 10–1. Is zero a credible value for the true regression slope?
Give an unbiased estimate for the error variance in the situation of problem 10€“11. In this problem and others, you may either use a computer or do the computations by hand.In problem An article in the Journal of Monetary Economics assesses the relationship between percentage growth in wealth
Find the standard errors of the regression parameter estimates for problem 10€“11.In problem An article in the Journal of Monetary Economics assesses the relationship between percentage growth in wealth over a decade and a half of savings for baby boomers of age 40 to 55 with these people's
Give 95% confidence intervals for the regression slope and the regression intercept parameters for the situation of problem 10€“11.In problem An article in the Journal of Monetary Economics assesses the relationship between percentage growth in wealth over a decade and a half of savings for
For the situation of problem 10–13, find the standard errors of the estimates of the regression parameters; give an estimate of the variance of the regression errors. Also give a 95% confidence interval for the true regression slope. Is zero a plausible value for the true regression slope at the
Repeat problem 10–23 for the situation in problem 10–17. Comment on your results.Recently, research efforts have focused on the problem of predicting a manufacturer’s market share by using information on the quality of its product. Suppose that the following data are available on market
What is the main difference between correlation analysis and regression analysis?
Compute the sample correlation coefficient for the data of problem 10€“11.In problem An article in the Journal of Monetary Economics assesses the relationship between percentage growth in wealth over a decade and a half of savings for baby boomers of age 40 to 55 with these people's income
What are the assumptions of the simple linear regression model?
Is it possible that a sample correlation of 0.51 between two variables will not indicate that the two variables are really correlated, while a sample correlation of 0.04 between another pair of variables will be statistically significant? Explain.
The following data are indexed prices of gold and copper over a 10-year period. Assume that the indexed values constitute a random sample from the population of possible values. Test for the existence of a linear correlation between the indexed prices of the two metals.Gold: 76, 62, 70, 59, 52, 53,
A study was conducted to determine whether a correlation exists between consumers’ perceptions of a television commercial (measured on a special scale) and their interest in purchasing the product (measured on a scale). The results are n = 65 and r = 0.37. Is there statistical evidence of a
Using the Fisher transformation (described in footnote 5), carry out a two-tailed test of the hypothesis that the population correlation coefficient for the situation of problem 10–34 is p = 0.22. Use α = 0.05.
An interesting marketing research effort has recently been reported, which incorporates within the variables that predict consumer satisfaction from a product not only attributes of the product itself but also characteristics of the consumer who buys the product. In particular, a regression model
A regression analysis was carried out of returns on stocks (Y) versus the ratio of book to market value (X). The resulting prediction equation isY = 1.21 + 3.1X (2.89)where the number in parentheses is the standard error of the slope estimate. The sample size used is n = 18. Is there evidence of a
In the situation of problem 10€“11, test for the existence of a linear relationship between the two variables.In problem An article in the Journal of Monetary Economics assesses the relationship between percentage growth in wealth over a decade and a half of savings for baby boomers of age 40
In the situation of problem 10–13, test for the existence of a linear relationship between the two variables.
For Example 10–4, test for the existence of a linear relationship between returns on the stock and returns on the market as a whole.
A regression analysis was carried out to determine whether wages increase for blue-collar workers depending on the extent to which firms that employ them engage in product exportation. The sample consisted of 585,692 German blue-collar workers. For each of these workers, the income was known as
An article in Financial Analysts Journal discusses results of a regression analysis of average price per share P on the independent variable X/k, where X/k is the contemporaneous earnings per share divided by firm-specific discount rate. The regression was run using a random sample of 213 firms
A management recruiter wants to estimate a linear regression relationship between an executive’s experience and the salary the executive may expect to earn after placement with an employer. From data on 28 executives, which are assumed to be a random sample from the population of executives that
Results of a study reported in Financial Analysts Journal include a simple linear regression analysis of firms’ pension funding (Y) versus profitability (X). The regression coefficient of determination is reported to be r2 = 0.02. (The sample size used is 515.) a. Would you use the regression
What percentage of the variation in percent growth in wealth is explained by the regression in problem 10€“11?In problem An article in the Journal of Monetary Economics assesses the relationship between percentage growth in wealth over a decade and a half of savings for baby boomers of age 40
What is r2 in the regression of problem 10–13? Interpret its meaning.In problem Recently research efforts have focused on the problem of predicting a manufacturer’s market share by using information on the quality of its product. Suppose that the following data are available on market share, in
What is r2 in the regression of problem 10€“16?In problem An article in Worth discusses the immense success of one of the world€™s most prestigious cars, the Aston Martin Vanquish. This car is expected to keep its value as it ages. Although this model is new, the article reports resale
A financial regression analysis was carried out to estimate the linear relationship between long-term bond yields and the yield spread, a problem of significance in finance. The sample sizes were 242 monthly observations in each of five countries, and the results were the obtained regression r2
Analysts assessed the effects of bond ratings on bond yields. They reported a regression with r2 = 61.56%, which, they said, confirmed the economic intuition that predicted higher yields for bonds with lower ratings (by economic theory, an investor would require a higher expected yield for
Find r2 for the regression in problem 10–15.In problemInflation (%) Total Return on Stocks (%)1 ................–32 ................3612.6 ..............12–10.3 ...............–80.51 ...............532.03 ...............–2–1.8 ...............185.79 ...............325.87 ...............24
Starting with equation 10€“28, derive equation 10€“29.In equation 10-28In equation 10-29
Conduct the F test for the existence of a linear relationship between the two variables in problem 10€“11.In problem
Carry out an F test for a linear relationship in problem 10–13. Compare your results with those of the t test.In problem Recently, research efforts have focused on the problem of predicting a manufacturer’s market share by using information on the quality of its product. Suppose that the
Repeat problem 10–57 for the data of problem 10–17.In problem Recently, research efforts have focused on the problem of predicting a manufacturer’s market share by using information on the quality of its product. Suppose that the following data are available on market share, in percentage
In a regression, the F statistic value is 6.3. Assume the sample size used was n = 104, and conduct an F test for the existence of a linear relationship between the two variables.
In a simple linear regression analysis, it is found that b1 = 2.556 and s (b1) 4.122. The sample size is n = 22. Conduct an F test for the existence of a linear relationship between the two variables.
Using the definition of the t statistic in terms of sums of squares, prove (in the context of simple linear regression) that t2 = F.
Produce residual plots for the regression of problem 10€“11. Is there any apparent model inadequacy?In problem An article in the Journal of Monetary Economics assesses the relationship between percentage growth in wealth over a decade and a half of savings for baby boomers of age 40 to 55 with
Repeat problem 10€“66 for the regression of problem 10€“13.In problem An article in the Journal of Monetary Economics assesses the relationship between percentage growth in wealth over a decade and a half of savings for baby boomers of age 40 to 55 with these people's income quartiles. The
Repeat problem 10€“66 for the regression of problem.Produce residual plots for the regression of problem. Is there any apparent model inadequacy?In problem
For the American Express example, give a 95% prediction interval for the amount charged by a member who traveled 5,000 miles. Compare the result with the one for x = 4,000 miles.
What are the purpose and meaning of the error term in regression?
For problem 10–69, give a 99% prediction interval.In problem For the American Express example, give a 95% prediction interval for the amount charged by a member who traveled 5,000 miles. Compare the result with the one for x = 4,000 miles.
For problem 10€“11, give a point prediction and a 99% prediction interval for wealth growth when the income quartile is 5.In problem
For problem 10€“72, give a 99% prediction interval for wealth growth when the income quartile is 5.In problem
For problem 10€“16, give a 95% prediction interval for the present value when the model is from the 1990s.In problem
For problem 10€“16, give a 95% prediction interval for the present value when the model is from the 2000s.In problem
Consider the following sample data of X and Y:X Y8 ............22.306 ............16.719 ............25.216 ............15.841 ............ 2.758 ............21.222 ............ 5.271 ............ 2.3210 .............27.397 ............19.35a. Regress Y against X without any constraints. What is
A regression was carried out aimed at assessing the effect of the offer price of an initial public offering (IPO) on the chances of failure of the firm issuing the IPO over various time periods from the time of the offering (the maximum length of time being 5 years). The sample was of 2,058 firms,
A regression analysis was performed to assess the impact of the perception of risk (credit card information theft, identity theft, etc.) on the frequency of online shopping. The estimated slope of the regression line of frequency of shopping versus level of perceived risk was found to be – 0.233
The following data are operating income X and monthly stock close Y for Clorox, Inc. Graph the data. Then regress log Y on X.X ($ millions): 240, 250, 260, 270, 280, 300, 310, 320, 330, 340, 350, 360, 370, 400, 410, 420, 430, 450Y ($s): 45, 42, 44, 46, 47, 50, 48, 60, 61, 59, 67, 75, 74, 85, 95,
One of several simple linear regressions run to assess firms’ stock performance based on the Capital Asset Pricing Model (CAPM) for firms with high ratios of cash flow to stock price was the following. Firm excess return = 0.95 + 0.92 Market excess return + Error The standard error of the
A simple regression produces the regression equation Y-bar = 5X + 7.a. If we add 2 to all the X values in the data (and keep the Y values the same as the original), what will the new regression equation be?b. If we add 2 to all the Y values in the data (and keep the X values the same as the
Showing 17200 - 17300
of 88243
First
166
167
168
169
170
171
172
173
174
175
176
177
178
179
180
Last
Step by Step Answers
.png)
.png)
.png)
.png)
.png)
.png)
.png)
.png)
.png)
.png)
.png)
.png)
-1.png)
-2.png)
.png)
.png)

.png)

.png)
.png)

